

A report from Real Capital Analytics (RCA) said that multifamily property prices rose 13.5 percent in the year to August. This is the highest annual rate of price appreciation seen for this asset class since early 2006. Apartments were again the commercial real estate property class with the highest annual rate of price appreciation in the month, although the retail sector saw higher price appreciation month-over-month.
Defining the index
Real Capital Analytics tracks an index they call the Commercial Property Price Index (CPPI). The index is computed based on the resale prices of properties whose earlier sales prices and sales dates are known. The index represents the relative change in the price of property over time rather than its absolute price. Note that, as properties are added to the RCA dataset each month, they recalculate the CPPI all the way back to the beginning of the data series.
Prices rise broadly
RCA reported that multifamily property prices were up 1.6 percent month-over-month in August. The month-over-month price appreciation for all commercial property viewed as a single asset class was only marginally lower than that of apartments, while year-over-year price appreciation for commercial property was 13.5 percent.
Price appreciation for retail properties was 1.9 percent for the month and 12.1 percent over the past 12 months. The year-over-year comparison was boosted by the price declines this sector was experiencing one year ago. Prices for industrial properties rose 1.3 percent for the month and 13.6 percent over the past 12 months. Office buildings within central business districts (CBDs) were again the worst performing sector with no price change for the month and a 3.7 percent decline over the prior 12 months. However, all offices as a single asset class experienced price growth of 11.2 percent for the year.
Tracking price changes
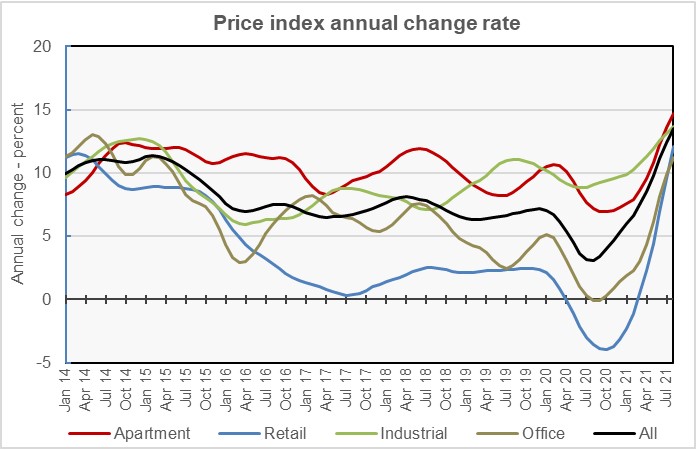
The first chart, below, plots the year-over-year changes in the CPPI values since January 2014 for each of the four main property classes as well for all commercial property as a single asset class. It shows that apartments and industrial have generally been the best performing asset classes. Retail was hardest hit by the pandemic, but its performance has also lagged significantly since late 2015.
The next chart takes another look at the data, this time focusing on the monthly rate of property price changes for multifamily and for all commercial property viewed as a single asset class.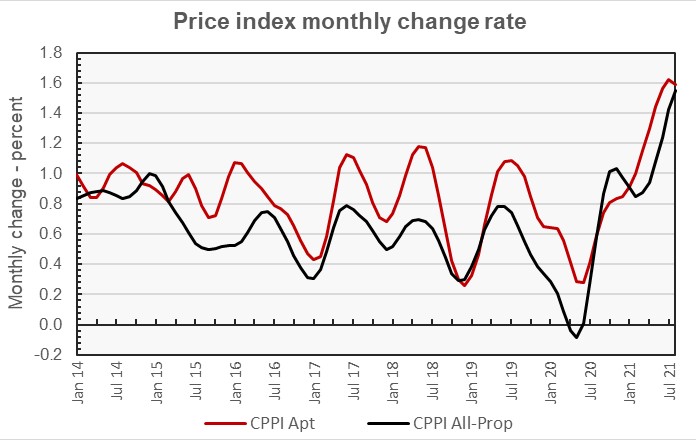
This chart shows that the monthly rate of appreciation in multifamily property prices has been greater than that of commercial property as a single asset class since late last year. However, its rate of price appreciation seems to have crested while that of commercial property in general is still rising.
Major metros lag
The RCA report provides data comparing the changes in commercial property prices in 6 major metro areas* against those in the rest of the country, although it does not separate out multifamily property prices from those of other commercial property types in this comparison. The last chart, below, looks at the data based on the year-over-year rate of price changes.
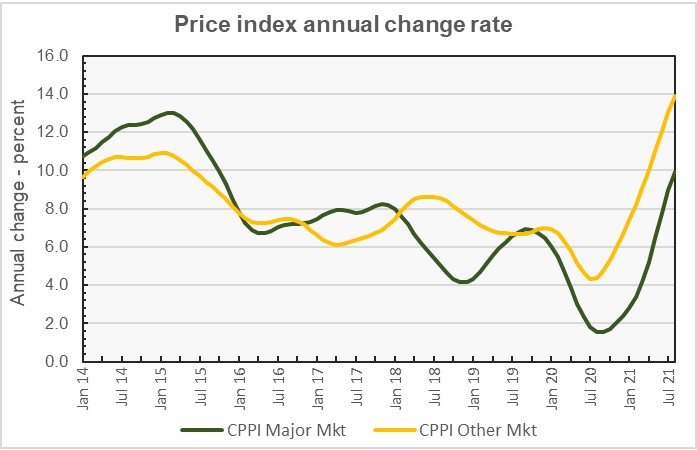
The chart shows that the major markets underperformed the rest of the country almost without exception since January 2018. However, the difference in performance of the two markets hit its peak in March 2021 and has been narrowing lately.
By the numbers, appreciation in commercial property prices in major markets was reported to be 1.1 percent for the month and 9.9 percent for the year. Appreciation for commercial property prices in non-major markets was reported to be 1.4 percent for the month and 13.9 percent for the year
The full report provides more detail on other commercial property types. Access to the RCA report can be obtained here.


