

The latest CoStar report on the change in prices of commercial property in the United States said that multifamily property prices rose 12.5 percent over the last 12 months, but multifamily is no longer the fastest appreciating commercial property type.
Defining the index
The CoStar report focuses on a relative measure of property prices called the CoStar Commercial Repeat Sales Index (CCRSI). This index is computed based on the resale of properties whose earlier sales prices and sales dates are known. The index represents the relative change in the price of property over time rather than its absolute price. Real Capital Analytics uses a similar approach in their research.
In September 2021, there were 1,812 sales pairs for all of the property types tracked by CoStar. Since CoStar does not break out the number of transactions by property type, we do not know how many of those transactions were for multifamily properties.
Comparing commercial property types
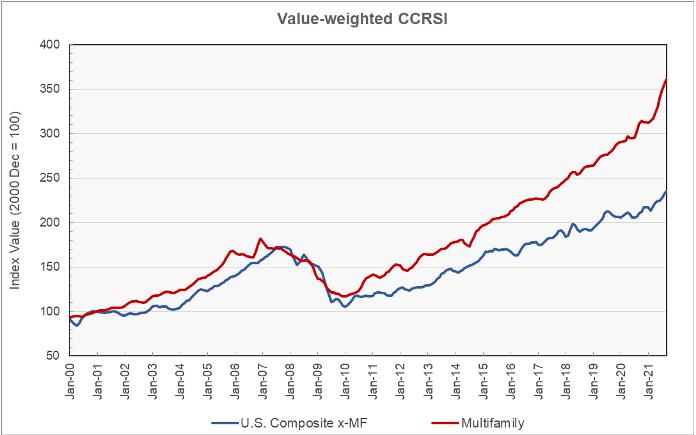
The first chart shows how multifamily property prices have changed over time relative to the composite price of the other primary commercial property types CoStar tracks. The data is normalized so that both indexes are set to a value of 100 in December 2000. The change in the value of each index since then shows how the relative price of that property type has changed. The chart shows that multifamily property price gains have exceeded the composite of the price rises of other commercial property types over the last 20 years. It also shows that multifamily property prices have recently surged higher.
The second chart focuses on the price trends of these two indexes since the start of 2012 and it looks at them in terms of year-over-year price growth. The chart also included lines representing the average rate of price change for each asset group over the time period illustrated in the chart.
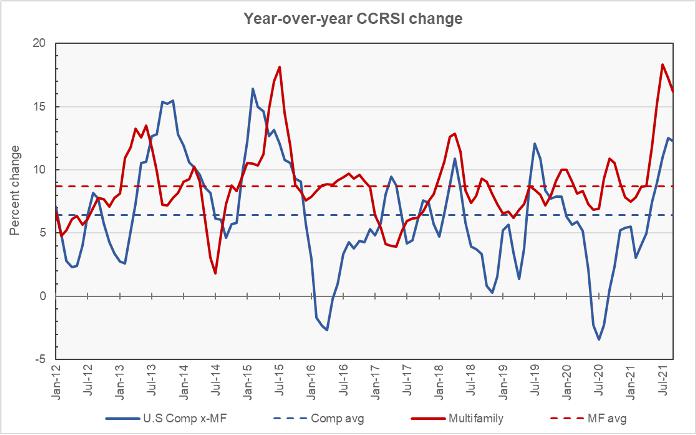
The chart shows the recent surge in multifamily property prices. It also shows that a price surge of this magnitude is not unprecedented. However, when this last happened in 2015, the period of high price growth was accentuated by there being very low price growth in the same period of the prior year. The recent uptick in the index of commercial property x-multifamily is similarly being aided by the index having experienced actual declines the year before. However, the surge in multifamily property prices this year comes after those prices rose at nearly the long-term average rate last year.
The lines representing the average rate of price appreciation for the two indexes show that the average rate of growth in multifamily property prices has exceeded that of other commercial property taken together by 2.2 percent per year over the 9+ year time span represented.
Looking closer
Some of the CoStar’s results, such as those for individual commercial property types, are only reported on a quarterly basis. This is presumably so that enough sales-pairs can be recorded in these smaller sub-categories that the results aren’t unduly influenced by a few atypical sales. The latest report includes the results for Q3 2021 and so it contains the full range of perspectives CoStar offers.
When comparing the equal-weighted CCRSI from Q3 2021 to that of Q3 2020, the best performing commercial property type was industrial, with a 13.9 percent price appreciation. The next best was retail at 13.7 percent, followed by land at 13.3 percent. Multifamily property price appreciation was 12.5 percent on this basis. Office prices rose 5.2 percent while prices for hospitality properties dropped 1.5 percent.
CoStar also calculates a value-weighted CCRSI. This index puts more emphasis on the fewer, high-priced property sales than on the more numerous but lower-priced transactions. The year-over-year rise in the value-weighted CCRSI for multifamily properties was only 11.6 percent. The fact that this rise was lower than that for the equal-weighted CCRSI implies that prices are rising less rapidly for higher-priced multifamily properties than they are for lower-priced properties.
Comparing regions
The next chart shows how the CoStar multifamily price indexes for the four Census regions of the United States have changed since 2000. As before, each of the indexes is normalized to a value of 100 in December 2000, and the chart shows the relative change in value since then. Having a higher index value for a give region does not necessarily mean that the price of the property in dollars per door or dollars per square foot is higher than in the other regions since the property prices were different by region in December 2000, which is used as the basis for comparison.

The chart shows that the Northeast has been the region with the highest appreciation in multifamily property prices since December 2000, but the growth in prices there has slowed since 2017. Price appreciation in the West region has continued at a strong pace and the gap between the indexes for the West and for the Northeast has been closing. The CCRSI for the South has also risen steadily in recent years.
Using CoStar’s equal weighted indexes and comparing to year-earlier levels, prices were up by 14.1 percent in the South, 11.5 percent in the West, 9.1 percent in the Midwest and 5.7 percent in the Northeast.
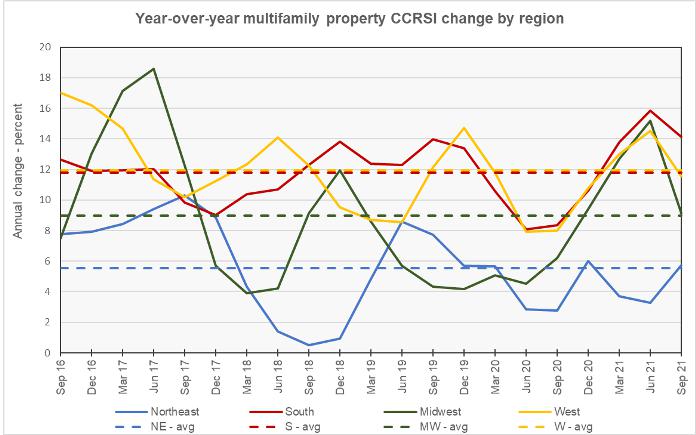
The last chart shows the year-over-year change in the regional multifamily property price indexes for the last 5 years along with the average rates of appreciation in the CCRSI for each region over that time. The chart shows that the average performance for property in the Northeast has lagged that of the other regions of the country and, since March 2020, the appreciation of the CCRSI for Northeast property has even underperformed its 5-year average. On the other hand, the West and the South have had nearly equal rates of price appreciation, averaging over double the rate in the Northeast.
The full report has additional information about transaction volumes, including “distressed” transactions. However, this data is not broken out by property type. The full report can be found here.


