

A report from Real Capital Analytics (RCA) said that multifamily property prices rose 16.3 percent in the year through September. However, unlike in recent reports, apartments were overtaken by both office and industrial properties for the fastest rate of year-over-year price appreciation.
Defining CPPI
Real Capital Analytics tracks an index they call the Commercial Property Price Index (CPPI). The index is computed based on the resale prices of properties whose earlier sales prices and sales dates are known. The index represents the relative change in the price of property over time rather than its absolute price. Note that, as properties are added to the RCA dataset each month, they recalculate the CPPI all the way back to the beginning of the data series.
Prices on the rise
In addition to the 16.3 percent rate of price growth over the prior 12 months, RCA reported that multifamily property prices were up 1.7 percent for the month of September. This compares to a 2.0 percent monthly and a 14.1 percent annual price increase for all commercial property types considered as a single asset class.
The volume of multifamily property sales reached $178.5 billion through the first nine months of 2021. This sales volume is nearly as high as that seen for any full year since RCA began tracking this data in 2000 despite 3 months remaining in this year.
Price appreciation for industrial properties was 1.9 percent for the month and 16.9 percent over the past 12 months, outpacing apartments. Office buildings as a single property class experienced price appreciation of 2.5 percent for the month and 16.9 percent for the last 12 months, with suburban offices appreciating 20.2 percent year-over-year. However, office buildings within central business districts (CBDs) were again the worst performing commercial property sector that RCA tracks, with a price increase of only 0.3 percent for the month and a price decline of 1.2 percent over the prior 12 months. Office buildings within CBD’s was the only commercial property class tracked by RCA whose prices today are lower than they were 12 months ago.
Tracking price appreciation
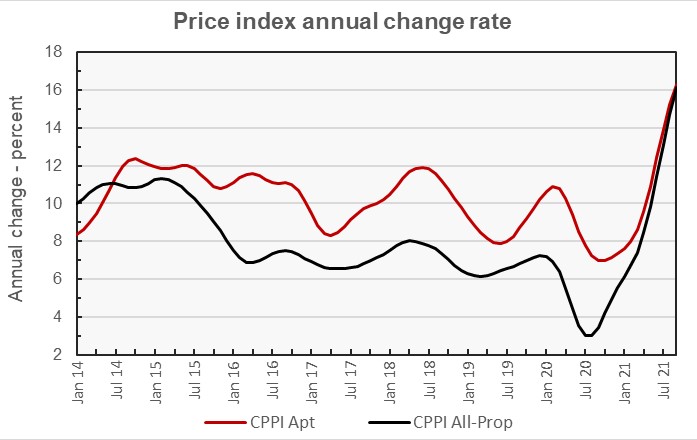
The first chart, below, plots the year-over-year change in the values of the CPPI for all commercial property as a single asset class and for apartments. It shows that the rate of price appreciation for multifamily property was less affected by the pandemic-induced turmoil of last summer. However, the annual price appreciation for all commercial property as a single asset class now nearly matches that of multifamily property.
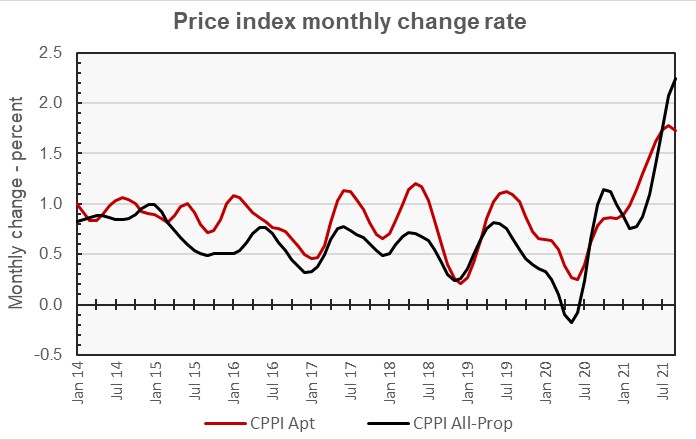
The next chart takes another look at the data, this time focusing on the monthly rate of property price changes. This chart shows an underlying cyclical pattern in the price appreciation data. It also shows that multifamily property price appreciation has recently begun to lag that of commercial property as-a-whole on a month-over-month basis.
Major metros reach a crest
The RCA report provides data comparing the price changes of commercial property in 6 major metro areas* against those in the rest of the country, although it does not separate out apartments from other commercial property types in this comparison. The last chart, below, looks at the data based on the month-over-month rate of price appreciation since January 2014.
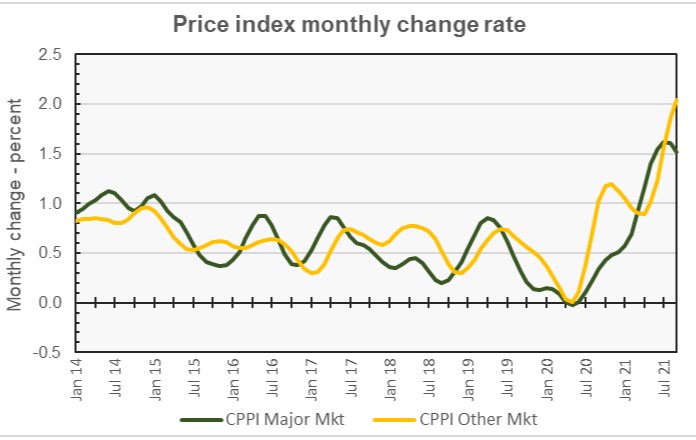
The chart shows that prices in the non-major markets recovered more quickly, if less monotonically, from last year’s slowdown than did those in the major markets until recently. However, the monthly rate of price appreciation in the major markets has now slowed. It will be worth watching how deep this slowdown becomes and how long it lasts.
By the numbers, price appreciation for commercial property in major markets was reported to be 1.5 percent for the month and 13.2 percent for the year. Price appreciation for commercial property in non-major markets was reported to be 2.0 percent for the month and 16.1 percent for the year
The full report provides more detail on other commercial property types. Access to the RCA report can be obtained here.
*The major metros are Boston, Chicago, Los Angeles, New York, San Francisco and Washington DC.


