

The Census Bureau released its quarterly report on home ownership and occupancy. It showed that the rental housing vacancy rate was 5.8 percent in Q3 2021, down from a level of 6.2 percent in Q2. In Q1 2020, before the effects of the pandemic were widespread, the rental vacancy rate was 6.6 percent.
A grain of salt
Data collection in the summer of 2020 was challenging due to the pandemic and some of the results reported by the Census Bureau seem unlikely. This was discussed in our last report on this topic and will not be repeated here.
Slicing and dicing vacancies
The headline vacancy rate reported by Census, 5.8 percent in Q3, is for all rental housing in the country, both single-family and multifamily. Census breaks down this figure in various ways, including by the number of units in the building. The chart, below, illustrates this comparison. The chart shows that single family rentals have historically had lower vacancy rates than did multifamily rentals and that the difference between the rates widened after 2016. Recently, multifamily vacancy rates have fallen while single-family vacancy rates seem to have reached a floor.
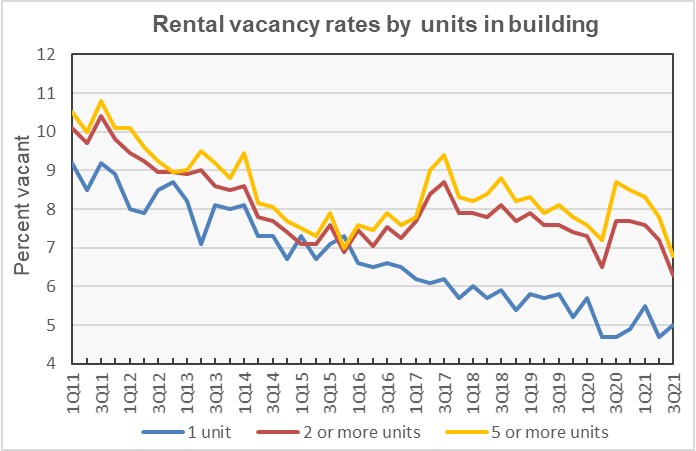
By the numbers, the single-family vacancy rate was 5.0 percent in Q3, up from 4.7 percent in Q2 but down from the 5.7 percent rate reported in Q1 2020. The vacancy rate for units in buildings with 5 or more units was 6.8 percent in Q3, down from 7.8 percent in Q2 and down from 7.6 percent in Q1 2020.
The rental vacancy rate in the core cities of the Census Bureau’s Metropolitan Statistical Areas (MSAs) was 5.7 percent in Q3. This was up from the rate of 5.6 percent reported in Q2 but down from the rate of 6.4 percent recorded in Q1 2020. The rental vacancy rate in the suburbs of the MSAs was 4.7 percent in Q3. This was down from the 5.4 percent rate reported in Q2 and also down from the 6.2 percent rate recorded in Q1 2020.
Tracking rentership
The Census Bureau reported that 34.6 percent of the country’s 126,914,000 occupied housing units were inhabited by renter households in Q3 2021. This rate effectively the same as that in Q2 and also the same as that in Q1 2020. The history of the number of occupied housing units and the share of renter households since 2011 is shown in the next chart, below. The chart shows that renters have occupied a decreasing portion of housing units since 2016.
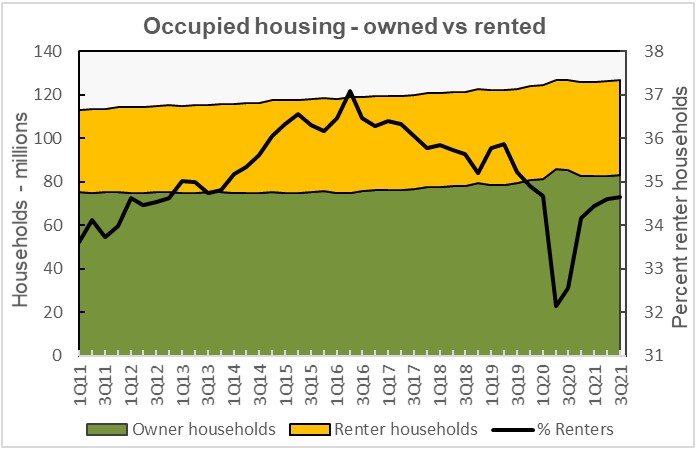
While the share of housing units occupied by renters has fallen, the number of renter-occupied housing units has remained relatively steady. The number of renter-occupied housing units reached 44 million in Q2 2016 and has remained within 1 million of that figure since then, if the pandemic period with its dubious readings is excluded. The number of renter-occupied housing units in Q3 2021 was 44 million. However, the number of owner-occupied housing units has risen from 74.7 million in Q2 2016 to 83 million in Q3 2021.
Regional rent reporting
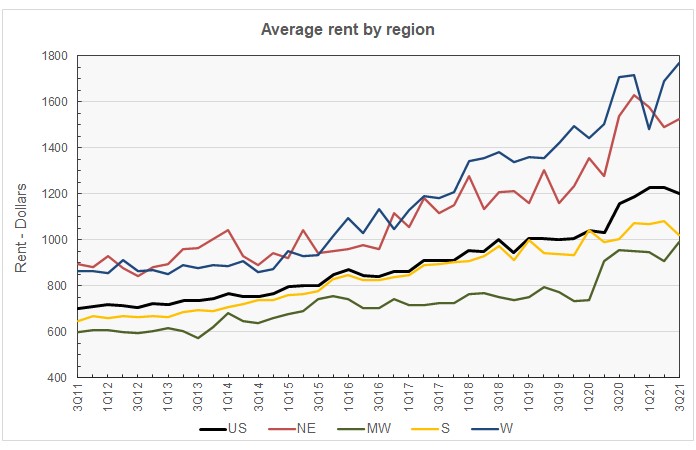
The Census Bureau also tracks the median asking rents in the country as-a-whole and in the four Census regions. The history of their findings is shown in the next chart, below. Nationally, rents have moved higher recently but they may have now crested. The amount of month-to-month variation in the regional rent data makes detecting short term trends difficult. However, it appears that the West is currently the strongest regions for rent growth.
The Census report is called Quarterly Residential Vacancies and Homeownership, Third Quarter 2021. It is available here.


