

The Census Bureau released its quarterly report on home ownership and occupancy. It showed that the rental housing vacancy rate fell from 6.9 percent in Q2 2019 to 6.3 percent in Q2 2021. The reported number of occupied rental housing units fell by 243,000 units and the reported number of vacant rental housing units fell by 312,000 units over that time.
A grain of salt
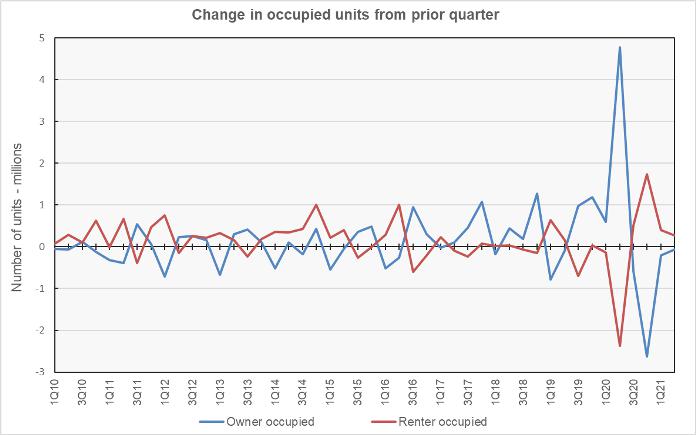
The pandemic caused problems for the Census Bureau in attempting to collect data on the economy in 2020, particularly in Q2 and Q3 when the lockdowns were at their tightest. This is illustrated in the first chart, below. The chart shows that the number of owner-occupied housing units was reported to jump by nearly 4.8 million in the locked-down second quarter of 2020, only to fall by 3.4 million over the next three quarters. The number of renter-occupied housing units was reported to fall by 2.4 million in Q2 2020, only to rise by 2.6 million over the next three quarters. As it seems unlikely that a net of nearly 5 million new households purchased homes in Q2 2020 while the economy was locked down, the numbers from that quarter should probably be viewed with some skepticism. That is why the comparisons above were made to the figures from Q2 2019 rather than Q2 2020 and why many of the comparisons below include figures from Q1 2020, before the lockdowns.
A wide view
The census report takes a broad look at the nation’s rental housing, including both single family and multifamily rental housing. The report found that 34.6 percent of the country’s 126,155,000 occupied housing units were inhabited by renter households in Q2 2021. This rate is down 1.3 percent from rate in Q2 2019 but up 2.5 percent from the rate reported for Q2 2020. The history of the share of renter households since 2010 is shown in the first chart, below. The chart shows that renters have occupied a decreasing portion of housing units since 2016.
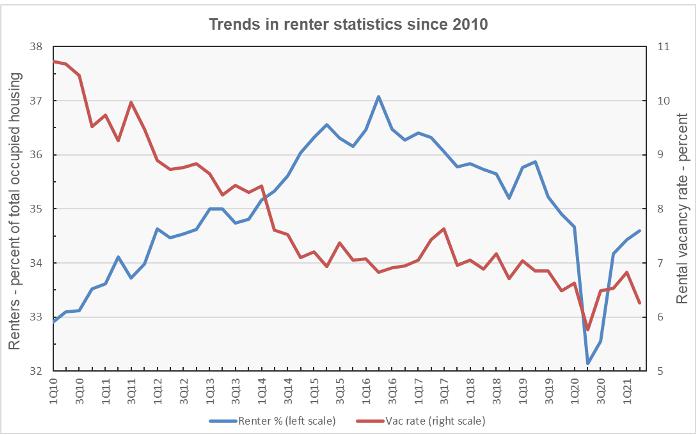
The chart also shows the rental vacancy rate since 2010. The vacancy rate fell as the portion of housing occupied by renters rose. Once the portion of renters started to fall, around 2016, the rental vacancy rate hit a plateau.
The migration continues
The rental vacancy rate in the core cities of the Census Bureau’s Metropolitan Statistical Areas (MSAs) was 6.4 percent in Q1 2020, prior to the pandemic. It was reported as 5.6 percent in Q2 2020 before rising to 6.7 percent in Q2 2021. The rental vacancy rate in the suburbs of the MSAs was 6.2 percent in Q1 2020. It was reported as 5.3 percent in Q2 2020 and 5.4 percent in Q2 2021. The rental vacancy rate in regions outside the MSAs was 9.1 percent in Q1 2020. It was reported as 8.2 percent in Q2 2020 before falling to 6.9 percent in Q2 2021. Therefore, vacancies are up slightly in urban core areas and down significantly in rural areas.
Regional differences
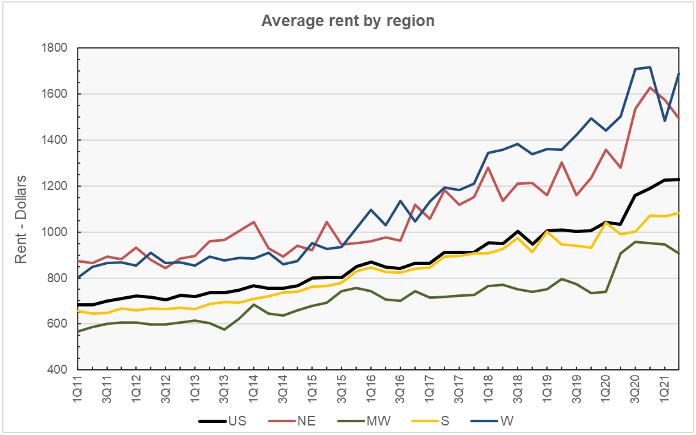
The Census Bureau also tracks the median asking rents in the country as-a-whole and in the four Census regions. The history of their findings is shown in the next chart, below. Rents are highest in the West and lowest in the Midwest. Over the last 15 months, rents have recovered, or nearly recovered, in the South and in the West. However, rents are still down in the Northeast and the Midwest.
Size matters
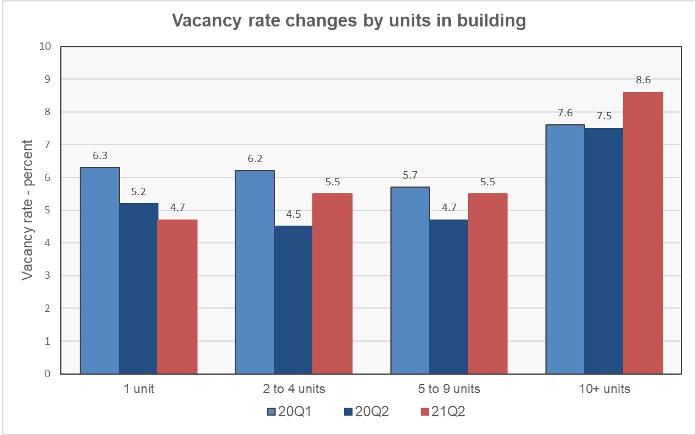
The final chart, below, shows how the vacancy rates have changed since Q1 2020 by building size. It includes data on both Q1 and Q2 2020 for comparison to Q2 2021. Since Q1 2020, vacancy rates have fallen for smaller buildings while they have risen for buildings with more than 10 units. Larger buildings are more likely to be found in urban areas.
When compared to the reported vacancy rates for Q2 2020, rates have risen for all building sizes except for single-family homes.
The Census report is called Quarterly Residential Vacancies and Homeownership, Second Quarter 2021. It is available here.


