

CoStar reported that its value-weighted index of multifamily property prices fell 1.0 percent month-over-month in March, the seventh decline in a row. This index was down 11.0 percent year-over-year.
The value-weighted index of non-multifamily commercial property prices fell 0.2 percent month-over-month in March. This index fell 8.9 percent year-over-year. The other commercial property types tracked by CoStar are office, retail, industrial and hospitality.
For more information on the CoStar Commercial Repeat Sales Indexes (CCRSI’s), please see the description at the bottom of this report.
Multifamily property prices lower
The first chart, below, shows the history of the value-weighted CCRSI’s since January 2016 for multifamily property and for all other commercial property considered as a single asset class. It also shows trend lines for the growth in the two CCRSI’s based on their growth in the period from January 2012 to January 2020. The indexes are normalized so that their values in December 2000 are set to 100.
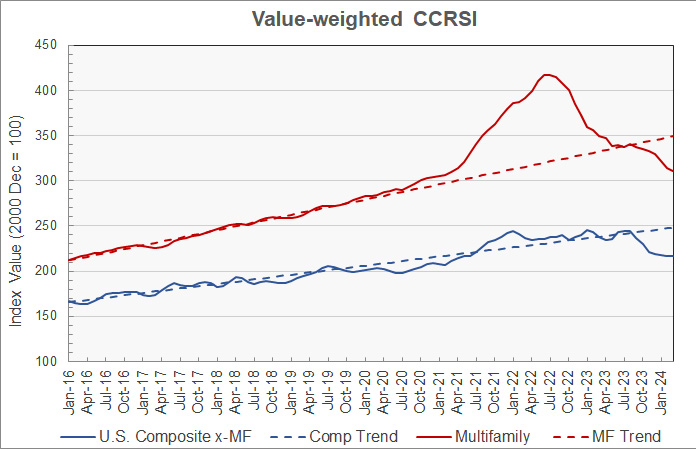
The chart shows that the fall in multifamily property prices accelerated in January and February but moderated in March. Multifamily property prices are now 25.6 percent below the peak they reached in July 2022, although they are still 9.8 percent above their level in January 2020, prior to the pandemic.
The rate of decline in prices for other commercial property types has slowed since its recent peak last November. These prices are now 11.9 percent below their high point and 12.8 percent below their pre-pandemic trend. However, they are still 7.5 percent above their level in January 2020.
The second chart shows the year-over-year change in the value-weighted multifamily property price index and that for all other commercial property types since January 2016. It also shows the average rates of annual price growth for the two property classes since January 2012.
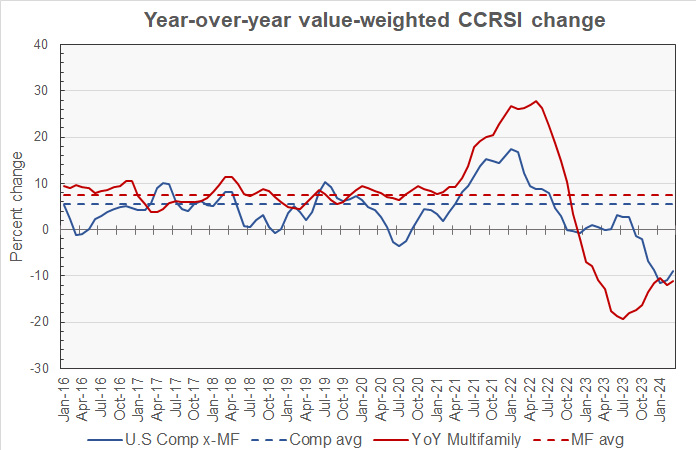
The chart shows that the year-over-year growth in both multifamily and non-multifamily property prices have been negative for some time and have recently stalled at around -10 percent.
Since January 2012, the average annual increase in multifamily property prices has been 7.4 percent while that of other commercial property prices has been 5.6 percent.
Your region may vary
CoStar’s end-of-quarter reports include information on changes in the equal-weighted CCRSI by property type by region. The history since Q1 2012 of these regional indexes for multifamily property is shown in the next chart, below. For purposes of this chart, the CCRSI for each of the four regions was normalized to a value of 100 in Q1 2012.
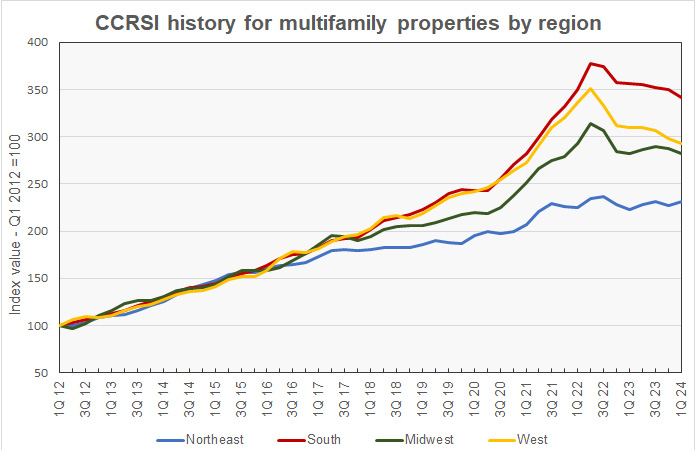
The chart shows that multifamily property prices in the Northeast region did not surge in 2022 the way they did in other regions. Prices in the Northeast have also not fallen in the last two years to the degree that they have in the other regions.
In Q1, multifamily property prices in the Northeast region rose while they fell in the other 3 regions. On a quarter-over-quarter basis, multifamily property prices in Q1 2024 were up by 1.7 percent in the Northeast. However, prices fell 2.3 percent in the South and 1.9 percent in both the Midwest and West.
Since 2016, the average year-over-year increase in the regional multifamily CCRSI for the Northeast region has been 5.3 percent. Average price appreciation has been 11.3 percent in the South, 8.6 percent in the Midwest and 9.9 percent in the West.
The next chart shows the history of the year-over-year regional multifamily property price changes by quarter since 2016. The chart shows that year-over-year price changes have mostly been negative over the past year but recently turned positive for the Northeast and Midwest regions.
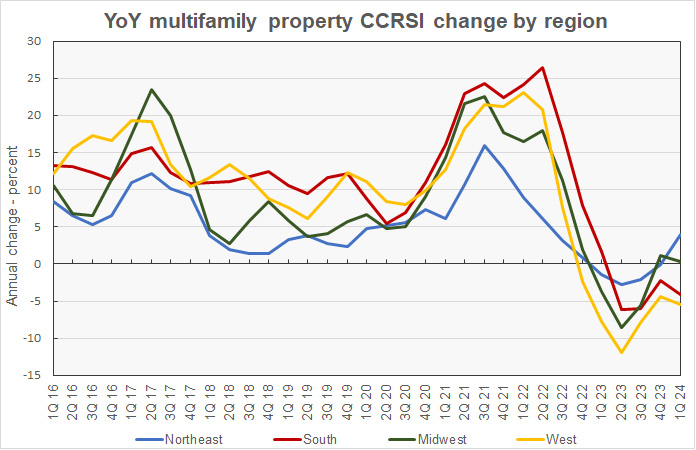
Based on CoStar’s equal-weighted quarterly indexes and comparing to year-earlier levels, prices in Q1 2024 were up by 4.0 percent in the Northeast and 0.3 percent in the Midwest. However, prices fell 4.1 percent in the South and 5.5 percent in the West.
Transaction volumes up
An issue with monthly transaction volume reporting is that CoStar usually identifies additional transactions to tabulate over the next few months after the initial report and these extra transactions tend to make initial reports of declining transaction volumes worse. However, in March, CoStar reported that the transaction volume was up both from the initial reported level for February and also from the revised level for February listed in this month’s report.
CoStar reported that the initial transaction count for March was 942 repeat sales pairs. This was up 17.3 percent from the initial level reported for February and was up 3.1 percent from the revised level given for February in this month’s report.
The preliminary dollar volume of transactions was reported to rise 6.0 percent from the revised level of the month before at $6.1 billion. It was up 17.1 percent from the preliminary level reported last month.
The full report discusses all commercial property types. While the CoStar report provides information on transaction volumes, it does not break out multifamily transactions. The latest CoStar report can be found here.
CCRSI defined
The CoStar report focuses on a relative measure of property prices called the CoStar Commercial Repeat Sales Index (CCRSI). The index is computed based on the resale of properties whose earlier sales prices and sales dates are known. The index represents the relative change in the price of property over time rather than its absolute price. CoStar identified 942 repeat sale pairs in March for all property types. These sales pairs were used to calculate the results quoted here.
CoStar computes CCRSI’s for a variety of property groupings, combining them by cost, region, property type or other factors. The value-weighted index is more heavily influenced by transactions of expensive properties than is CoStar’s equal-weighted index. The value-weighted index is the focus of this report because it is an index whose value is reported monthly and for which CoStar breaks out multifamily property as a separate category.


