

The latest CoStar report on the changes in the prices of commercial property in the United States said that the quarterly index of multifamily property prices rose 15.6 percent over the last 12 months. Industrial was the fastest appreciating property type with a rise in the quarterly index of 16.8 percent year-over-year.
Defining the index
The CoStar report focuses on a relative measure of property prices called the CoStar Commercial Repeat Sales Index (CCRSI). This index is computed based on the resale of properties whose earlier sales prices and sales dates are known. The index represents the relative change in the price of property over time rather than its absolute price. In December 2021, there were 3,106 sales pairs for all of the property types tracked by CoStar. Since CoStar does not break out the number of transactions by property type, we do not know how many of those transactions were for multifamily properties.
Multifamily vs other commercial property types
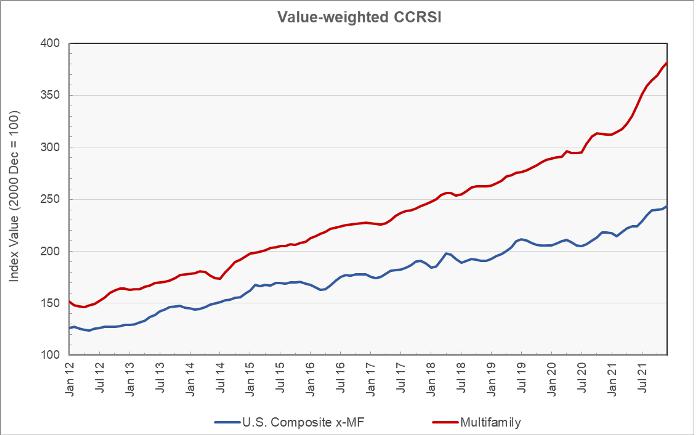
The first chart shows how monthly multifamily property price indexes have changed since January 2012 relative to the monthly composite price index of the other primary commercial property types CoStar tracks. The data is normalized so that both indexes are set to a value of 100 in December 2000. The change in the value of each index since then shows how the relative price of that property type has changed. The chart shows that multifamily property price gains have exceeded the composite of the price rises of other commercial property types over the last 20 years. It also shows that multifamily property prices have recently surged higher.
The second chart focuses on the price trends of these two indexes since the start of 2012 and it looks at them in terms of year-over-year price growth. The chart also includes lines representing the average rate of price change for each asset group over the time period illustrated in the chart.
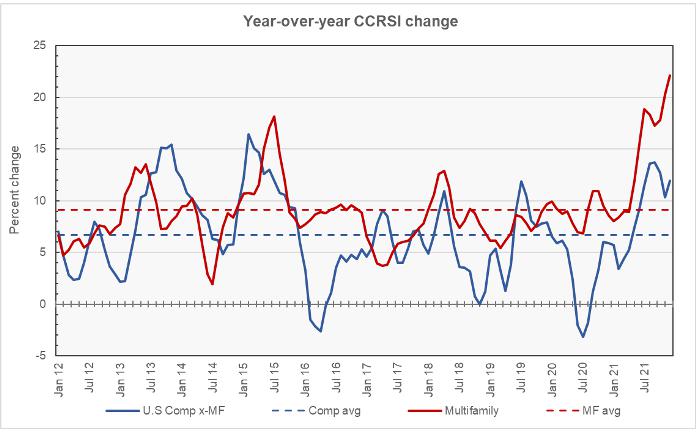
The chart shows a rapid rise in the monthly multifamily property price index since June 2021. The year-over-year rise in the index reached 22.1 percent in December, the highest level seen in the history of the CoStar series. This result is in line those reported earlier by Real Capital Analytics.
The month-over-month rise in the monthly multifamily property price index was 1.4 percent in December. This is well below the 4+ percent monthly increases that were seen in 2006 as the housing bubble inflated before the crash.
The lines representing the average rate of price appreciation for the indexes show that the average rate of growth in multifamily property prices has been 9.1 percent, while the average rate of growth of commercial property other than multifamily has been 6.7 percent over the 9+ year time span represented.
The full view
Some of CoStar’s results, such as those for individual commercial property types, are only reported on a quarterly basis. The December report includes the results for Q4 2021 and so it contains the full range of perspectives CoStar offers.
When comparing the equal-weighted CCRSI from Q4 2021 to that of Q4 2020, the best performing commercial property type was industrial, with a 16.8 percent price appreciation. The next best was multifamily at 15.6 percent, followed by retail at 12.5 percent. The quarterly land price index rose by 8.3 percent, the office price index rose by 7.6 percent and the hospitality price index rose by 3.0 percent year-over-year.
CoStar also calculates a value-weighted CCRSI. This index puts more emphasis on the fewer, high-priced property sales than on the more numerous but lower-priced transactions. The year-over-year rise in the value-weighted CCRSI for multifamily properties was 17.1 percent. The fact that this rise was higher than that for the equal-weighted CCRSI implies that prices are rising more rapidly for higher-priced multifamily properties than they are for lower-priced properties.
Regional differences matter
The next chart shows how the CoStar quarterly multifamily price indexes for the four Census regions of the United States have changed since 2000. As before, each of the indexes is normalized to a value of 100 in December 2000 and the chart shows the relative change in value since then. Having a higher index value for a give region does not necessarily mean that the price of the property in dollars per door or dollars per square foot is higher than in the other regions. This is because the property prices were different by region in December 2000, when the bases for comparison were established.
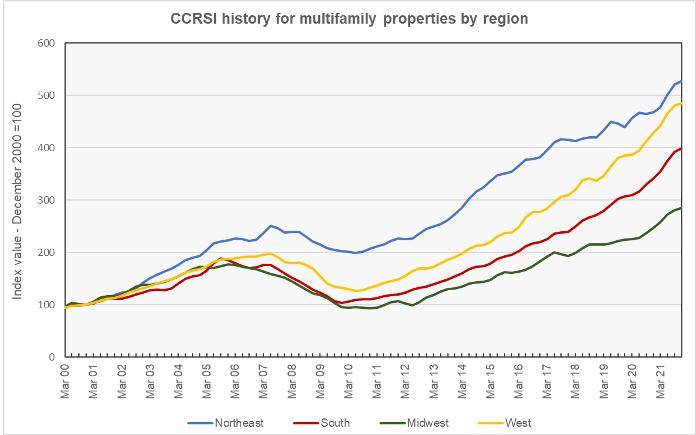
The chart shows that the Northeast has been the region with the highest appreciation in multifamily property prices since December 2000, but this is mostly due to it having a higher rate of price appreciation during the early years represented in the chart. In recent years, the growth in prices in the Northeast has slowed.
Price appreciation in the West region has been accelerating in recent years and the CCRSI for the West is closing in on that for the Northeast. However, since prices were likely higher in the Northeast than in the West in the baseline period of December 2000, prices would still be higher in the Northeast even if the price index in the West caught up with that in the Northeast.
Using CoStar’s equal weighted quarterly indexes and comparing to year-earlier levels, prices were up by 17.0 percent in the South, 15.5 percent in the Midwest, 13.3 percent in the West and 12.5 percent in the Northeast.
The next chart shows the year-over-year change in the regional multifamily property price indexes for the last 5 years along with the average rates of appreciation in the CCRSI for each region over that time.
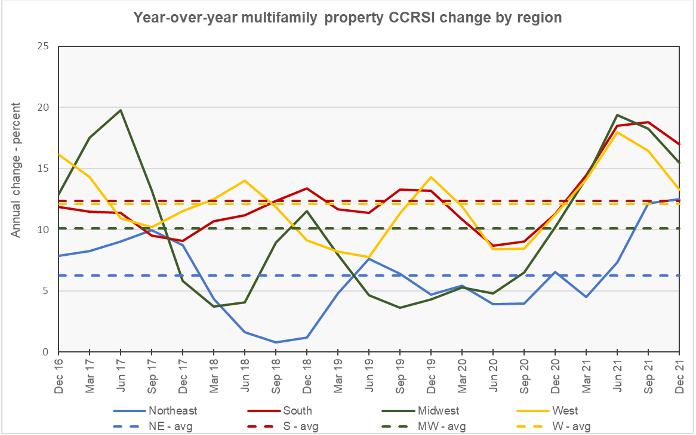
The chart shows that the performance of multifamily property in the 4 regions is not usually well correlated; prices rise in some regions while they simultaneously fall in others. However, over the last year, price movements were generally correlated with all regions experiencing rising property prices, although this effect occurred with a time lag in the Northeast.
The full report has additional information about transaction volumes, including “distressed” transactions. However, this data is not broken out by property type. The full report can be found here.


