

The Census Bureau’s report on construction spending shows that the value of residential construction put in place in December was up 1.1 percent from the revised level of the month before. Residential construction spending was up 15 percent year-over-year.
Multifamily construction spending creeping higher
The reported value of total private residential construction put in place in December 2021 came in at $810.3 billion on a seasonally adjusted, annualized basis. This figure, which includes spending on both new construction and on improvements, was reported to be up $9.1 billion from November’s revised figure. However, the preliminary figure reported for November was revised upward by $4.8 billion, so the preliminary figure for December is actually up by $13.9 billion from the preliminary figure for November reported last month.
The value of new private construction of multifamily residential buildings put in place in December was reported to be $101.2 billion on a seasonally adjusted, annualized basis. This was reported to be up $376 million from the revised level for November. However, the preliminary figure for November was revised upward by $838 million this month. The value of multifamily housing construction put in place in December 2021 was 9.1 percent higher than the level of December 2020.
State and local governments were reported to have put $6.8 billion in multifamily residential construction in place in December on a seasonally adjusted annualized basis.
The value of new single-family residential construction put in place in December was $435.0 billion on a seasonally adjusted, annualized basis. This was up 2.1 percent from the revised level for November and was up 16.3 percent from the level of December 2020.
The value of improvements to residential buildings put in place in December was reported to be $274.1 billion on a seasonally adjusted, annualized basis. This was up 15.2 percent from the year-earlier level but was down 0.1 percent from the revised level for November. The Census Bureau does not separate out improvements for single-family and multifamily residential buildings.
Charting the data
The chart, below, shows the history of new private residential construction spending since January 2000 for single-family housing, multifamily housing and residential improvements. It also shows a trendline for single-family construction based on the relatively steady growth in the value of construction put in place between 2013 and 2018.
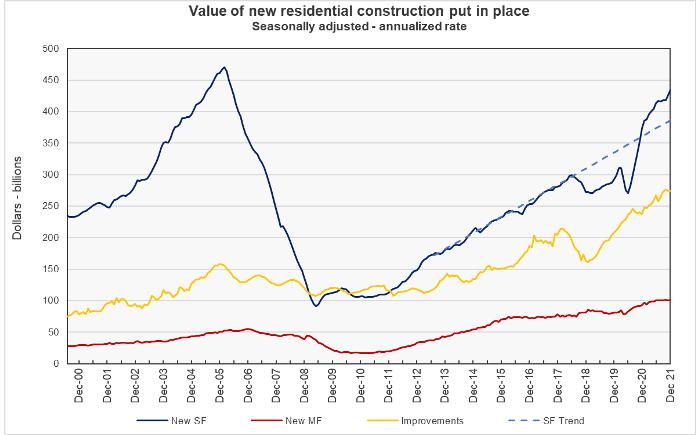
The chart shows that the value of single-family housing put in place in December is still about 7.5 percent below the peak level it reached in February 2006 during the housing bubble. However, the value of multifamily housing put in place in December is 84 percent higher than the prior peak reached in December 2006.
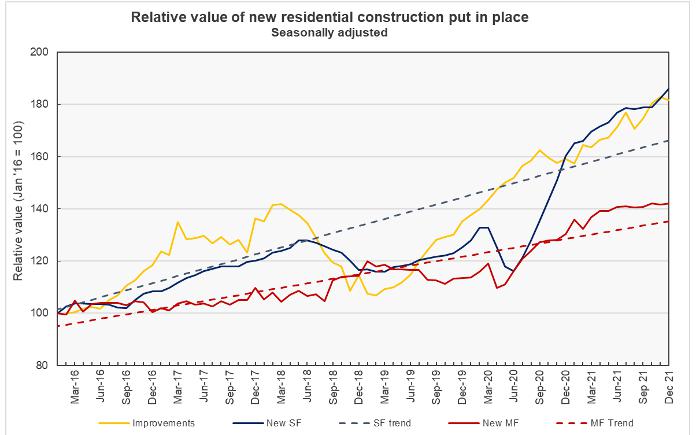
The last chart shows the same data with the values normalized to 100 in January 2016. This allows the recent trends in the values of the three types of construction put in place to be more directly compared. In addition, the chart contains trend lines for both single-family and multifamily housing. The steeper slope of the single-family trend line indicates that the value of single-family housing being put in place is growing significantly faster that that of multifamily housing.
The report from the Census Bureau also includes information on spending on other types of construction projects. The full report can be found here.


