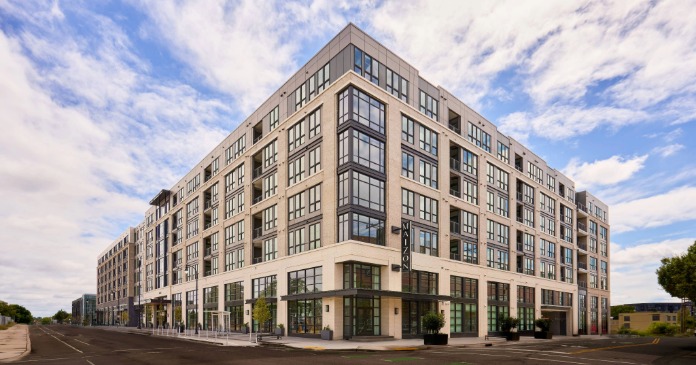
Yardi Matrix reported that the national average apartment rent rose $15 in April to $1,659 per month as rent growth declined slightly.
Rents growth rate still high but declining
The national average apartment rent was up 14.3 percent in April from its year-earlier level, a slightly lower rate of increase than was reported last month. This was the second month in succession with a declining rate of year-over-year rent growth after the record high for the Yardi Matrix data set of 15.4 percent reached in February. Rents in the “lifestyle” asset class, usually Class A properties, rose 15.6 percent year-over-year, while rents in “renter by necessity” properties increased by 13.1 percent year-over-year.
The rent figures being tracked by Yardi Matrix are asking rents for vacant units.
Yardi Matrix also reported that single-family rental (SFR) rents were up 13.2 percent year-over-year in April, reaching $2,018 per month. The national occupancy rate for single-family rentals was unchanged from its level last month.
Rent growth rankings
Of the top 30 metros by population, the ones with the largest annual apartment rent increases as ranked by Yardi Matrix are given in the table, below, along with their annual percentage rent changes.
| Metro | YoY rent change % |
| Miami Metro | 24.6 |
| Orlando | 24.1 |
| Tampa | 22.6 |
| Las Vegas | 22.1 |
| Phoenix | 20.7 |
| Orange County | 19.7 |
| New York | 18.3 |
| Austin | 18.1 |
| Raleigh | 17.9 |
| Nashville | 17.4 |
The major metros with the smallest year-over-year apartment rent growth as determined by Yardi Matrix are listed in the next table, below, along with the year-over-year rent increases for the metros.
| Metro | YoY rent change % |
| Twin Cities | 4.7 |
| San Francisco | 8.8 |
| Kansas City | 8.8 |
| Baltimore | 9.3 |
| Washington DC | 10.1 |
| Chicago | 10.7 |
| Houston | 11.6 |
| San Jose | 12.2 |
| Philadelphia | 12.2 |
| Indianapolis | 12.3 |
Occupancy, toujours occupancy
The discussion section of this month’s report focused on the shortfall in the growth of housing compared to the growth in the number of households in the United States. It quoted economists who estimated that the country went from a housing surplus following the financial crisis of 2008-2009 to a deficit of between 2 and 5 million units today.
Many factors cited as contributing to the shortfall in new housing construction are familiar to those following this market: shortages of land, rising construction costs, regulations and NIMBYism. However, the report also lists more recent factors, such as the increasing numbers of older households choosing to rent, and the increasing numbers of potential homebuyers being excluded from that market by rising home prices and mortgage interest rates.
In a note that is either cautionary or hopeful depending on your perspective, the report also suggests that the country’s slowing rate of population growth and the rising level of construction of new homes means that the housing shortage is on a path to ending.
SFR continues strong performance
Yardi Matrix also reported on the top 30 metros for single family rentals. The leading metros for year-over-year rent growth were Orlando, Miami and Las Vegas. SFR rents were up over 50 percent from year-earlier levels in Orlando and up over 20 percent in each of the other two of the top three metros.
All 30 of the metros covered saw positive rent growth compared to year-earlier levels, although about half of the metros listed in the report saw occupancies decline year-over-year.
The leading metros for year-over-year SFR occupancy growth were San Antonio, Philadelphia and Atlanta. Orange County, Baltimore and Sacramento saw the greatest SFR occupancy declines.
The complete Yardi Matrix report provides information on some of the smaller multifamily housing markets. It also has more information about the larger multifamily markets including numbers on job growth and completions of new units. It includes charts showing the history of rent changes in 18 of the top 30 markets over the last 4 years. It can be found here.


