

CoStar reported that its value-weighted index of multifamily property prices increased 21.6 percent, year-over-year, in May 2022. This index was up 1.4 percent month-over-month.
The combined value-weighted index of non-multifamily commercial property rose by 7.6 percent, year-over-year, in May. This index rose 0.9 percent month-over-month. The other commercial property types tracked by CoStar are office, retail, industrial and hospitality.
For more information on the CoStar Commercial Repeat Sales Indexes (CCRSI’s), see the section at the bottom of this report.
Comparing property types
The first chart, below, shows the history of the value-weighted CCRSI’s since January 2000 for multifamily property and for all other commercial property considered as a single asset class. It also shows trend lines for the growth in the two CCRSI’s based on their rate of growth in the period from January 2012 to January 2020. The indexes are normalized so that their values in December 2000 are set to 100.
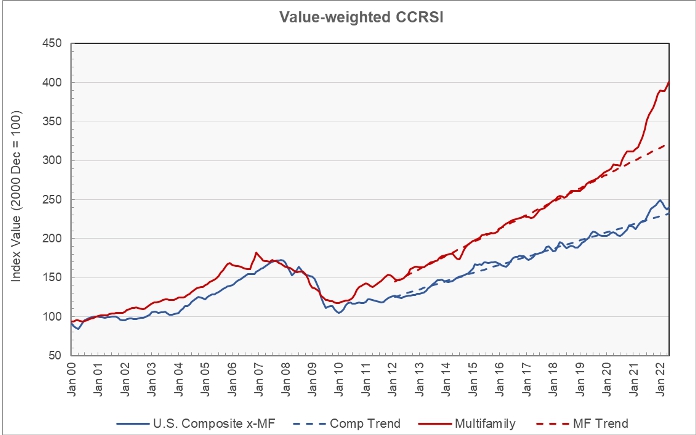
The chart shows that both indexes had remarkably steady growth in the years after the housing crash and before the onset of the pandemic. It also shows that the growth in both commercial property categories’ prices began to exceed the trend line during the pandemic year of 2020. However, the recent price growth rate for commercial property other than multifamily has been returning to the trend line. The growth in multifamily property prices has continued to be well above the recent trend.
The second chart shows the year-over-year change in the value-weighted multifamily property price index and that for all other commercial property types since January 2012. It also shows the average rates of annual price growth for the two property classes over that time.
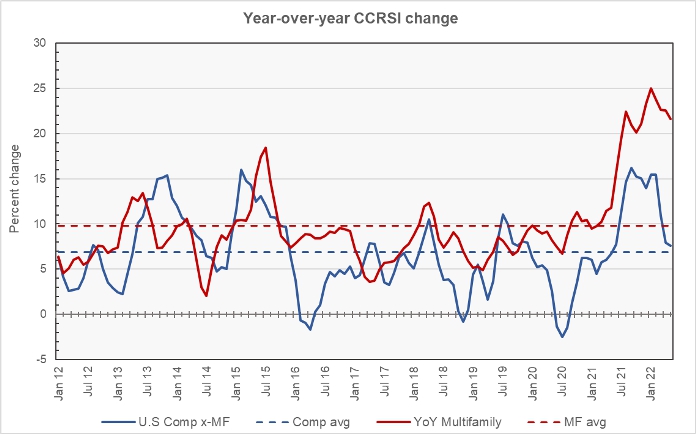
The chart shows that the year-over-year rate of increase in multifamily property prices has been above 20 percent since August 2021, although it has been slowly trending lower since January 2022. The year-over-year rate of increase for other commercial property prices has been in single-digits for the last two months and is now only 72 basis points above its 10-year average.
The annual increase in multifamily property prices has been 9.8 percent while that of other commercial property prices has been 6.9 percent. For comparison, Real Capital Analytics reports that the average annual increase in multifamily property prices has been 11.0 percent while that of other commercial property has been 8.4 percent.
Transaction volumes down again
CoStar reported that the number of repeat-sale transactions was down about 17 percent in May, falling 356 from April’s level. Transaction dollar volume was also down from April’s revised level, falling 9.3 percent to $15.6 billion.
While the CoStar report provides information on transaction volumes, it does not break out multifamily transactions. The latest CoStar report can be found here.
CCRSI defined
The CoStar report focuses on a relative measure of property prices called the CoStar Commercial Repeat Sales Index (CCRSI). The index is computed based on the resale of properties whose earlier sales prices and sales dates are known. The index represents the relative change in the price of property over time rather than its absolute price. CoStar identified 1,768 repeat sale pairs in May for all property types. These sales pairs were used to calculate the results quoted here.
CoStar computes CCRSI’s for a variety of property groupings, combining them by cost, region, property type or other factors. The value-weighted index is more heavily influenced by transactions of expensive properties than is CoStar’s equal-weighted index. The value-weighted index is the focus of this report because it is an index whose value is reported monthly and for which CoStar breaks out multifamily property as a separate category.
The full report discusses other commercial property categories, but detailed data on each of the property types and regional data are only reported quarterly and so are not included in this month’s report.


