

Yardi Matrix reported that the national average apartment rent rose $19 in June to $1,706 per month. However, this is $26 per month higher than the rent level reported last month, implying that last month’s average rent figure was revised upward $7 to $1,687.
Rents growth rate trending down
The national average year-over-year apartment rent growth was 13.7 percent in June, down fractionally from the rate of increase reported last month. After the record high rent growth rate reached in February for the Yardi Matrix data set, this was the fourth month in succession with a declining rate of year-over-year rent growth.
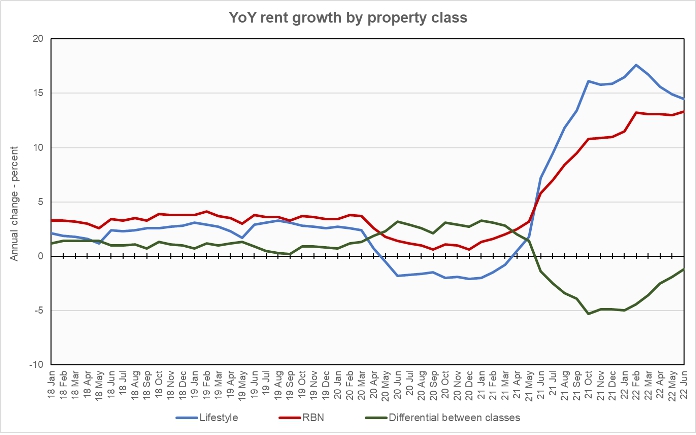
Rents in the “lifestyle” asset class, usually Class A properties, rose 14.5 percent year-over-year, while rents in “renter by necessity” (RBN) properties increased by 13.3 percent year-over-year. The chart, below, shows the history of the year-over-year rent growth rates for these two asset classes along with the difference between these rates. The chart shows that rents for lifestyle properties, which tend to be higher, consistently rose at a slower rate than did rents for RBN properties in the years before the pandemic. This would mean that the gap between the rents was closing. However, since June of last year, the rent growth rate for lifestyle properties has exceeded that for RBN properties, causing the gap to widen again.
The rent figures being tracked by Yardi Matrix are asking rents for vacant units.
Yardi Matrix also reported that single-family rental (SFR) rents were up 11.8 percent year-over-year in June, reaching $2,071 per month. The national occupancy rate for single-family rentals fell 0.1 percentage points.
Rent growth rankings
Of the top 30 metros by population, the ones with the largest annual apartment rent increases as ranked by Yardi Matrix are given in the table, below, along with their annual percentage rent changes.
| Metro | YoY rent growth % |
| Orlando | 24.0 |
| Miami Metro | 23.4 |
| Tampa | 20.3 |
| Orange County | 18.9 |
| Raleigh | 18.9 |
| Nashville | 18.1 |
| Las Vegas | 17.1 |
| Dallas | 17.0 |
| Charlotte | 16.9 |
| Inland Empire | 16.8 |
The major metros with the smallest year-over-year apartment rent growth rates as determined by Yardi Matrix are listed in the next table, below, along with the year-over-year rent increases for the metros.
| Metro | YoY rent growth % |
| Twin Cities | 5.1 |
| Baltimore | 9.4 |
| San Francisco | 9.7 |
| Chicago | 9.8 |
| Kansas City | 9.9 |
| Houston | 10.2 |
| Sacramento | 10.5 |
| Washington DC | 10.6 |
| Philadelphia | 11.4 |
| Los Angeles | 11.9 |
The top metros for month-over month rent growth in June were San Jose, Raleigh and Seattle. The metros with the lowest month-over-month rent growth were Las Vegas, Phoenix and Twin Cities. All 30 major metros tracked by Yardi Matrix saw positive month-over-month rent growth in June.
Drivers of occupancy
The report notes that the national apartment occupancy rate is currently 96 percent. This high apartment occupancy has been supported by the high rate of household formation in the wake of the pandemic. The report says that the high household formation rate has been achieved despite the decline in foreign immigration in the 5 years leading to 2020. It does not mention the surge in immigration over the past 18 months and what impact that might be having on rent growth.
The report also notes that, during the pandemic, people left high-cost, high-density areas for lower-cost, lower-density regions. However, the move to the latter regions has driven up rents there, reducing their attractiveness relative to that of the former regions. As a consequence, apartment absorption and rents are now rising everywhere.
SFR occupancy declines spread
Yardi Matrix also reported on the top 34 metros for single family rentals. Again this month, all 34 of the metros covered saw positive year-over-year rent growth. The leading metros for year-over-year rent growth were Orlando, Miami, Nashville and Toledo. SFR rents were up 47 percent from year-earlier levels in Orlando and up over 20 percent in each of the other top four metros.
Continuing a recent trend, more of the metros saw occupancy declines. This month, 24 of the metros saw occupancy declines while two other metros barely eked out occupancy increases. Last month, 21 of the metros listed in the report saw occupancy declines year-over-year, while two months ago only half of the covered metros saw occupancy declines.
The leading metros for year-over-year SFR occupancy growth were Philadelphia, Atlanta and Houston. Raleigh, Orange County and Baltimore saw the greatest SFR occupancy declines.
The complete Yardi Matrix report provides information on some of the smaller multifamily housing markets. It also has more information about the larger multifamily markets including numbers on job growth and completions of new units. It includes charts showing the history of rent changes in 18 of the top 30 markets over the last 4 years. It can be found here.


