

The latest rent report from Apartment List shows that the national average rent growth turned negative in September. Rents fell 0.2 percent month-over-month but still rose 7.5 percent year-over-year. The month-over-month decline was only the second time that this has happened in the last 21 months. The decline may indicate a return to a more normal rent growth cycle where rents rise in the spring and decline in the fall.
The pattern of rent growth
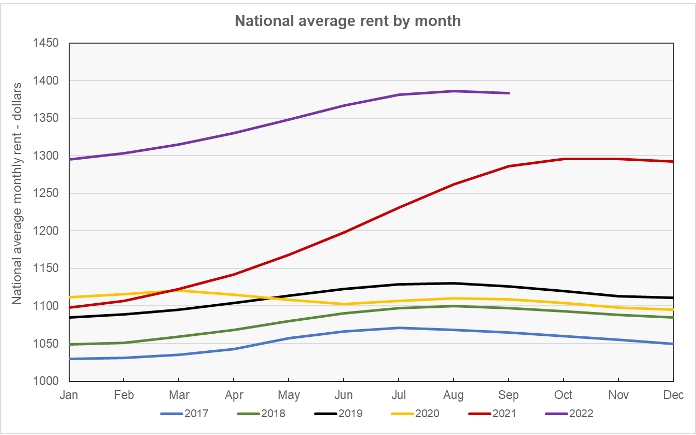
The first chart shows the history of the national average rent level since 2017. It is plotted year-by-year so that the annual change pattern is visible. The chart also shows the growth in the national average rent in 2022 through September. This chart is provided as a reference for comparison with the additional charts below.
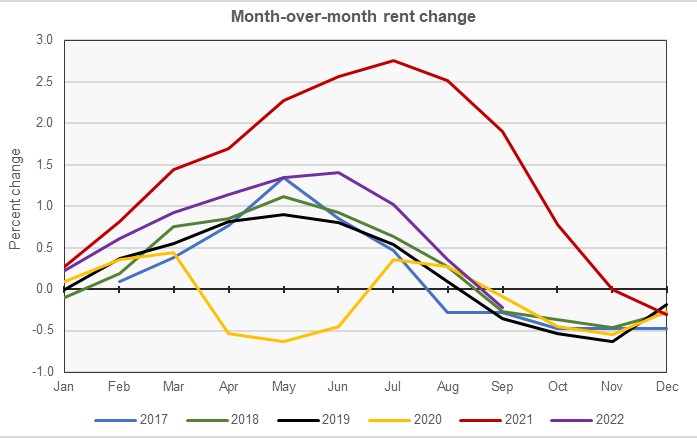
The next chart shows the month-over-month rent growth each year in the Apartment List data set. This month’s decline in the national average rent from the level of the month before is in line with the declines seen in the three years leading up to the pandemic.
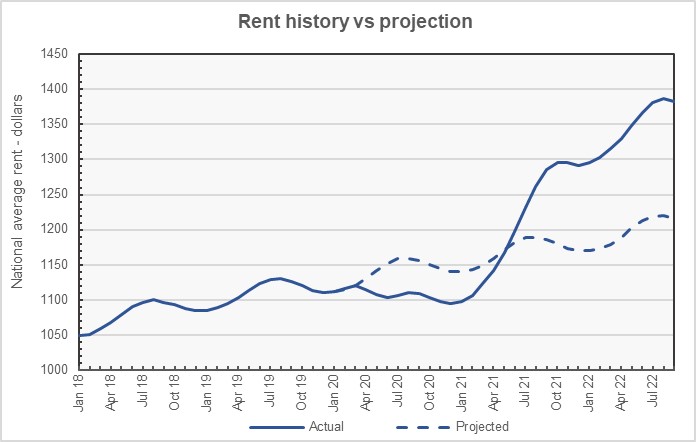
The history of rent changes for the last 4+ years is shown in the next chart, below, along with a projection of where rents would be if the pattern of growth that existed before the pandemic had continued. By this estimate, rents are now about $167 per month (14 percent) above where they would have been if they had followed the prior trend.
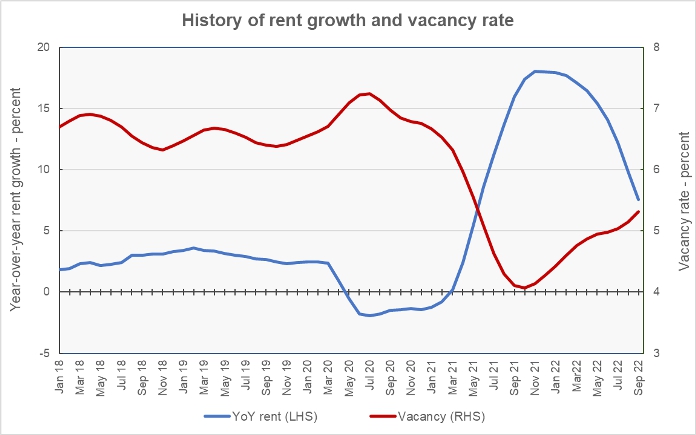
The final chart shows the year-over-year rate of rent growth since January 2018 plotted along with the national average apartment vacancy rate. It shows rents fell as the vacancy rate rose after March 2020, but rents then surged as the vacancy rate plunged in early 2021. The gradual rise in the vacancy rate over the last year has been accompanied by a decline in the year-over-year rent growth rate.
Leaders and trailers
Apartment List provides the underlying data they collected in compiling their report and that data was used to create the tables, below. The tables look at the 52 metropolitan statistical areas defined by the US Census Bureau with populations over 1 million and identify the top and bottom 10 metros for year-over-year rent growth. The tables provide the average monthly rent in the metro, the metro’s vacancy rate, the annual percentage change in rent (YoY Metro) along with the percentage change from the prior month’s rent level (MoM Metro). They also list the percentage change in rent for the metro area compared to the rent level in February 2020, right before the pandemic struck (Feb 20).
The first table shows the 10 metros with the largest annual rent percentage increases. While only one of the top ten metros for year-over-year rent growth saw its rents fall from July to August, all ten saw their rents fall month-over-month in September. In fact, of the 52 largest metros, 47 saw their rents decline in September.
| Metro | Metro Rent | Vacancy | YoY Metro | MoM Metro | Feb 20 |
| New York | $2,109 | 3.7 | 12.8 | -0.33 | 20.6 |
| San Diego | $2,436 | 3.6 | 12.3 | -0.12 | 35.2 |
| Orlando | $1,694 | 5.1 | 12.0 | -0.65 | 34.7 |
| Miami | $2,060 | 5.1 | 11.5 | -0.15 | 36.7 |
| Dallas | $1,503 | 6.1 | 10.8 | -0.07 | 27.7 |
| New Orleans | $1,253 | 4.6 | 10.8 | -0.63 | 23.0 |
| Rochester, NY | $1,351 | 5.5 | 10.5 | -0.73 | 45.4 |
| Salt Lake City | $1,520 | 5.9 | 10.4 | -0.07 | 33.2 |
| Charlotte | $1,464 | 6.1 | 10.3 | -0.61 | 29.8 |
| Nashville | $1,511 | 5.7 | 10.3 | -0.72 | 29.4 |
The next table shows the 10 metros with the smallest annual rent increases. Virginia Beach was the only metro of this group that did not experience falling rents in September.
| Metro | Metro Rent | Vacancy | YoY Metro | MoM Metro | Feb 20 |
| Sacramento | $1,766 | 4.3 | 1.3 | -0.73 | 25.5 |
| Las Vegas | $1,561 | 5.8 | 2.1 | -0.95 | 34.4 |
| Phoenix | $1,637 | 6.0 | 2.6 | -0.61 | 34.3 |
| Minneapolis | $1.232 | 6.8 | 2.8 | -0.16 | 5.5 |
| Virginia Beach | $1,612 | 4.0 | 3.0 | 0.06 | 26.7 |
| Baltimore | $1,652 | 4.4 | 3.1 | -0.18 | 20.5 |
| San Francisco | $2,174 | 5.1 | 3.3 | -0.69 | 0.2 |
| Detroit | $1,176 | 4.4 | 3.4 | -0.84 | 21.2 |
| Riverside | $1,974 | 3.9 | 3.5 | -1.20 | 36.4 |
| Jacksonville, FL | $1,539 | 6.0 | 3.8 | -0.39 | 35.7 |
The complete Apartment List report covers many more metros. It also provides readers with the opportunity to download their data sets. It can be found here.


