

The Bureau of Economic Analysis released its report on personal consumption expenditures (PCE) for the month of August. The overall PCE price index rose 0.3 percent for the month and 6.3 percent from the year-earlier level. The rental housing component of the PCE price index was up 0.7 percent month-over-month and 6.7 percent year-over-year.
While the rate of growth in the housing price index is lower than some of the rates of rent growth being reported by industry sources, it is more consistent with a recent report from the Bureau of Labor Statistics which indicated that many tenants have not faced sharp rent increases recently.
Why it matters
The PCE measure of inflation is an alternative to the perhaps better-known consumer price index (CPI), which is published by the Bureau of Labor Statistics. The PCE inflation index is significant since it is the measure of inflation that the Federal Reserve focuses on in setting interest rate policy.
The first chart, below, shows the history of the PCE price index since January 2013 along with key housing-related components of that index. The overall PCE housing plus utilities index covers housing cost inflation for both rental and owner-occupied housing as well as housing-related utility expense inflation. The chart also shows components of this index, including the rental housing price index, the imputed rent price index for owner-occupied housing and three categories of housing utility expenses.
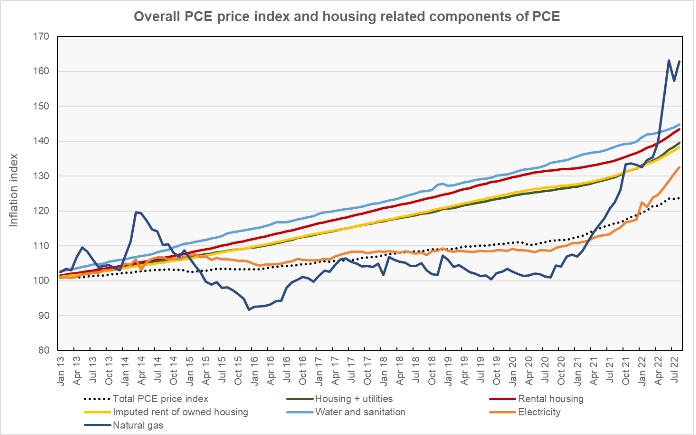
The chart shows that the overall PCE housing plus utilities price index closely tracks the index for imputed rent for owner-occupied housing. This is because 64 percent of U.S. housing spending goes to imputed rent for owner-occupied housing. While utility expenses have been volatile, housing utility expenses represent only about 15 percent of total housing plus utilities expense, so the effect of this expense volatility is muted.
The chart also shows that the rental housing price index has been higher than the overall housing price index since 2013 and that all of the housing-related components of the PCE price index have increased at a faster rate than the overall PCE index over the period shown.
Tracking the changes
The next chart shows the year-over-year change in the overall PCE price index and in some of its housing related components. Price index changes for gas and electricity were left out of this chart because their volatility would have required a much broader scale which would have made the changes in the more important indexes difficult to see.
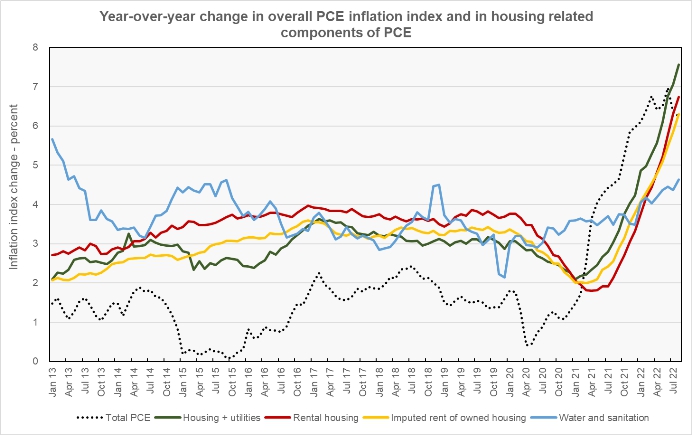
The chart shows that the year-over-year rate of price index growth for housing was higher than that for overall PCE until about January 2021. At that point, the growth in the overall PCE price index accelerated, exceeding the rates of year-over-year price index growth for housing components. However, as of August, the price indexes for overall housing plus utilities, for rental housing and for imputed rent for owner-occupied housing are all up more over the past 12 months than is the overall PCE price index. Therefore, while housing cost inflation has reduced the headline rate of inflation since January 2021, it may increase the overall inflation rate in the months ahead.
The full report from the BEA is available here.


