

Yardi Matrix reported that national average apartment rent growth stalled in September with rent remaining unchanged from their August level at $1,718 per month.
YoY rent growth rate slide continues
The national average apartment rent was up 9.4 percent in September from its year-earlier level. This rate of increase was down 1.5 percentages point from that reported last month. This was the seventh month in succession with a declining rate of year-over-year rent growth and the first time that the rate of year-over-year rent growth as measured by Yardi Matrix has not been in double digits in over a year.
Rent growth for leases that were renewed was 10.8 percent, slightly higher than the rate for new leases.
Rents in the “lifestyle” asset class, usually Class A properties, rose 8.3 percent year-over-year, while rents in “renter by necessity” (RBN) properties increased by 10.2 percent year-over-year. The chart, below, shows the history of the year-over-year rent growth rates for these two asset classes along with the difference between these rates.
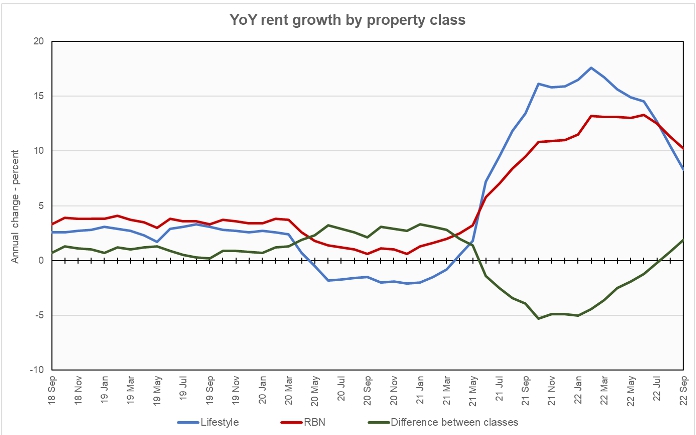
The chart shows that rents for RBN properties have risen at a faster rate than rents for lifestyle properties for the last two months. This is a return to the pattern that existed in the leadup to the pandemic. However, in September the difference between the rates of rent growth was larger than was typical in the pre-pandemic years.
The rent figures being tracked by Yardi Matrix are asking rents for vacant units.
Yardi Matrix also reported that single-family rental (SFR) rents fell $7 during the month to $2,081 per month. The year-over-year rent growth rate fell to 7.8 percent. The national occupancy rate for single-family rentals fell 0.1 percentage points. Occupancy fell in 26 of the 34 metros tracked in the report, up one from last month’s report.
New data along with rent growth
Starting this month, Yardi Matrix is reporting on other key rental market metrics in addition to rent growth. These include the average rent to income ratio, the rent growth rate for residents who renew their leases and the portion of residents who do renew. The metro averages are included in the tables below, but the report also includes the rent to income ratios for both lifestyle and for RBN properties. Occupancy data is also frequently discussed in these Yardi Matrix reports, but that data is not routinely presented on a metro-by-metro basis and so is not tabulated here.
Of the top 30 metros by population, the ones with the largest annual apartment rent increases as ranked by Yardi Matrix are given in the table, below, along with their annual percentage rent changes, overall rent to income ratio, rent growth for renewed leases and renewal rate for the month.
| Metro | YoY rent growth % | Rent to income ratio % | YoY renewal rent growth % | Monthly lease renewal rate % |
| Miami Metro | 14.3 | 27.3 | 20.8 | 63.9 |
| Orlando | 13.3 | 31.4 | 18.8 | 63.6 |
| Nashville | 13.2 | 30.3 | 11.0 | 56.4 |
| Dallas | 11.9 | 27.5 | 12.6 | 58.2 |
| Indianapolis | 11.6 | 25.9 | 9.4 | 61.4 |
| Tampa | 11.6 | 31.1 | 15.7 | 62.1 |
| Orange County | 11.3 | 33.6 | 7.6 | 57.7 |
| Raleigh | 10.8 | 27.6 | 16.1 | 62.1 |
| Charlotte | 10.4 | 27.9 | 16.0 | 58.5 |
| San Jose | 10.1 | 28.3 | 6.6 | 43.2 |
The major metros with the smallest year-over-year apartment rent growth as determined by Yardi Matrix are listed in the next table, below, along with the other data as in the table above.
| Metro | YoY rent growth % | Rent to income ratio % | YoY renewal rent growth % | Monthly lease renewal rate % |
| Twin Cities | 2.7 | 28.1 | 5.2 | 55.2 |
| Baltimore | 5.5 | 31.4 | 11.5 | 66.1 |
| Houston | 6.1 | 27.0 | 7.4 | 58.7 |
| Phoenix | 6.5 | 28.8 | 15.3 | 58.6 |
| Atlanta | 6.8 | 28.7 | 12.4 | 59.9 |
| Chicago | 6.8 | 27.8 | 6.3 | 59.5 |
| Las Vegas | 6.9 | 29.3 | 15.5 | 59.9 |
| Sacramento | 7.2 | 32.4 | 8.2 | 55.0 |
| San Francisco | 7.5 | 32.1 | 3.7 | 39.1 |
| Philadelphia | 7.7 | 29.3 | 8.4 | 69.6 |
The top metros for month-over month rent growth in September were Sacramento, Boston and Orange County, none of whom made this list last month. The metros with the lowest month-over-month rent growth were Atlanta, Orlando and Inland Empire. Only Inland Empire is a carry-over from last month. Of the 30 major metros tracked by Yardi Matrix, 18 saw negative month-over-month rent growth in September.
Renewals vs rates
The report notes that year-over-year renewal rent growth rates declined in the first year of the pandemic, dropping near zero in February 2021. They then rose steadily, especially when inflation surged starting in May 2021. Renewal rent growth rates have plateaued since April as the portion of people renewing their leases declined from 67.7 percent in February to 59.1 percent in September.
Households and housing
The discussion section of the report highlights the return to a “normal” level of apartment absorption this year after a record-breaking 2021. That record absorption was driven by the accumulation of household wealth during the pandemic, which gave more people the ability to form new households. While the labor market is currently still strong, supporting households, rising interest rates are likely to drive up unemployment which may impede household formation in the months ahead.
SFR market also softens
Yardi Matrix also reported on the top 34 metros for single family rentals. This month, 33 of the 34 metros covered saw positive year-over-year rent growth, with Atlanta being the only exception. The leading metros for year-over-year rent growth were Washington D.C. (39.7 percent), Orlando (35.6 percent) and Toledo (15.1 percent).
This month, 26 of the metros saw year-over-year declines in occupancy, up 1 from last month. The leading metros for year-over-year SFR occupancy growth were Philadelphia, Lansing and Cleveland. Las Vegas, Miami and Tampa saw the greatest SFR occupancy declines.
The complete Yardi Matrix report provides information on some of the smaller multifamily housing markets. It also has more information about the larger multifamily markets including numbers on job growth and completions of new units. It includes charts showing the history of rent changes in 18 of the top 30 markets over the last 4 years. It can be found here.


