

CoStar reported that its value-weighted index of multifamily property prices was down 1.4 percent month-over-month in October, the fourth monthly decline in a row. However, this index was still up 10.5 percent, year-over-year.
The value-weighted index of non-multifamily commercial property rose by 2.8 percent, year-over-year, in October. This index rose 0.1 percent month-over-month. The other commercial property types tracked by CoStar are office, retail, industrial and hospitality.
For more information on the CoStar Commercial Repeat Sales Indexes (CCRSI’s), please see the section at the bottom of this report.
Comparing property types
The first chart, below, shows the history of the value-weighted CCRSI’s since January 2012 for multifamily property and for all other commercial property considered as a single asset class. It also shows trend lines for the growth in the two CCRSI’s based on their growth in the period from January 2012 to January 2020. The indexes are normalized so that their values in December 2000 are set to 100.
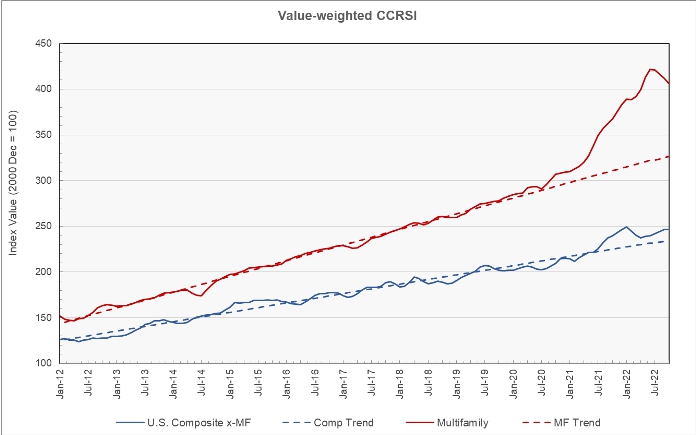
The chart shows that multifamily property prices began to deviate significantly from their trend line in March 2021. The CCRSI for other commercial property followed in September. While multifamily property prices reached their peak variation from the trend line in June 2022, they have recently been moving back toward the trend line. In October the multifamily CCRSI was 24.4 percent above the trend line. The CCRSI for non-multifamily commercial property was 5.1 percent above its trend line.
The second chart shows the year-over-year change in the value-weighted multifamily property price index and that for all other commercial property types since January 2012. It also shows the average rates of annual price growth for the two property classes over that time.
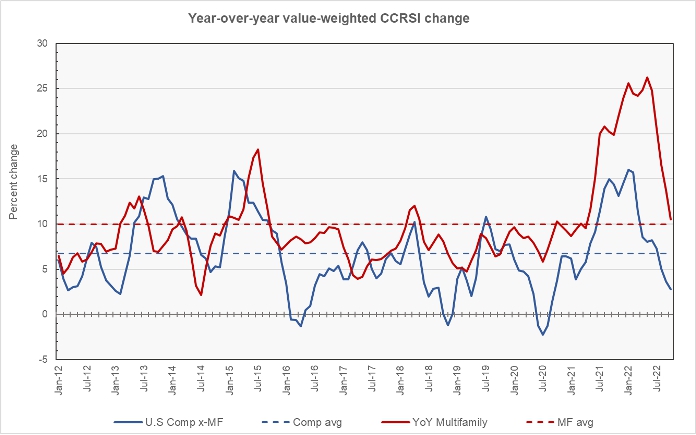
The chart shows that the year-over-year rate of increase in multifamily property prices has been falling sharply after reaching a peak of over 25 percent in January 2022. The October year-over-year rate of growth in multifamily property prices is only slightly higher than the 10.0 percent average rate of price growth over the time period covered by the chart. However, if we only consider the pre-pandemic period from January 2012 to December 2019, the average rate of year-over-year growth in multifamily property prices is only 8.3 percent, showing the significance of the recent period of rapid price appreciation to long term price growth.
The average rate of year-over-year growth for other commercial property prices has been 6.8 percent since January 2012, well above the October figure. Only considering the period from January 2012 to December 2019 changes the average to 6.6 percent per year, indicating that commercial property prices have deviated much less from trend over the last 2 years than have multifamily property prices.
For comparison, MSCI Real Capital Analytics reports that the average annual increase in multifamily property prices has been 11.1 percent while that of other commercial property has been 8.4 percent.
Transaction volumes down
The preliminary number of transactions reported for October was down 22.6 percent from the revised level of the month before. The preliminary dollar volume of transactions was also down, falling 26.7 percent. However, compared to the preliminary numbers reported last month, the number of transactions in October was down only 8.2 percent and the dollar volume of transactions was down only 6.1 percent.
The following chart gives a history of the last 6 months of reports for the number of transactions for each month since May. Looking at the group of 6 vertical bars for May, the leftmost bar shows the number of transactions first reported for May in the CoStar CCRSI report issued in June. Each subsequent bar shows how the number was revised in the following monthly reports. The rightmost of the bars for May shows the transaction count listed for that month in CoStar’s CCRSI report issued in November.
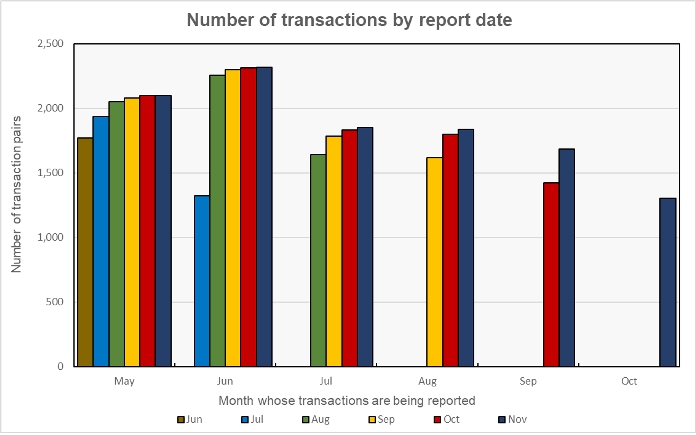
The chart shows that sometimes the preliminary transaction count for a month is revised significantly in the following month or months. For example, the preliminary transaction count for June was revised strongly upward the next month. The preliminary transaction count reported for September last month also had a significant revision in this month’s report. So, while the data in the October CCRSI report indicated that the transaction count dropped 21.2 percent from August to September, the data in the November CCRSI report indicates that the transaction count dropped only 8.3 percent between those same months. The point is that it is necessary to wait a few months for the data to stabilize in order to be able to accurately assess the trends in the data.
The full report discusses all commercial property types. While the CoStar report provides information on transaction volumes, it does not break out multifamily transactions. The latest CoStar report can be found here.
CCRSI defined
The CoStar report focuses on a relative measure of property prices called the CoStar Commercial Repeat Sales Index (CCRSI). The index is computed based on the resale of properties whose earlier sales prices and sales dates are known. The index represents the relative change in the price of property over time rather than its absolute price. CoStar identified 1,303 repeat sale pairs in October for all property types. These sales pairs were used to calculate the results quoted here.
CoStar computes CCRSI’s for a variety of property groupings, combining them by cost, region, property type or other factors. The value-weighted index is more heavily influenced by transactions of expensive properties than is CoStar’s equal-weighted index. The value-weighted index is the focus of this report because it is an index whose value is reported monthly and for which CoStar breaks out multifamily property as a separate category.


