

CoStar reported that its value-weighted index of multifamily property prices was down 1.4 percent month-over-month in November, the fifth monthly decline in a row. However, this index was still up 6.1 percent year-over-year.
The value-weighted index of non-multifamily commercial property also fell by 1.4 percent, month-over-month in November. This index fell 2.0 percent year-over-year. The other commercial property types tracked by CoStar are office, retail, industrial and hospitality.
For more information on the CoStar Commercial Repeat Sales Indexes (CCRSI’s), please see the section at the bottom of this report.
Comparing property types
The first chart, below, shows the history of the value-weighted CCRSI’s since January 2012 for multifamily property and for all other commercial property considered as a single asset class. It also shows trend lines for the growth in the two CCRSI’s based on their growth in the period from January 2012 to January 2020. The indexes are normalized so that their values in December 2000 are set to 100.
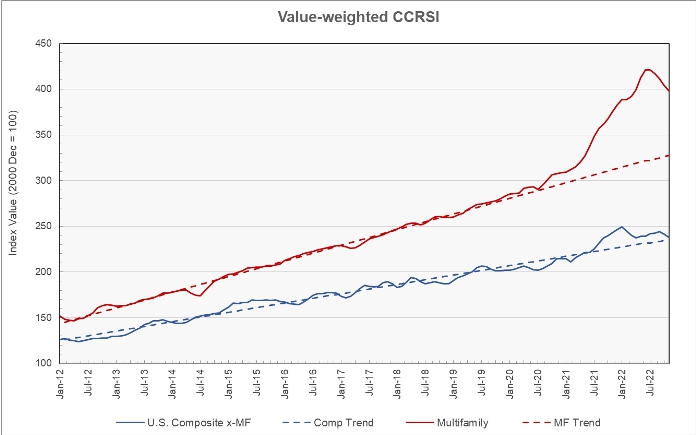
The chart shows that multifamily property prices rose at a remarkably steady rate in the years after the global financial crisis right up to the early months of the COVID pandemic. Property prices then surged as the rents grew at an unprecedented rate. The recent decline in multifamily property prices is moving them closer to the trend line, although they still are significantly higher than their long-term trend would predict.
The second chart shows the year-over-year change in the value-weighted multifamily property price index and that for all other commercial property types since January 2012. It also shows the average rates of annual price growth for the two property classes over that time.
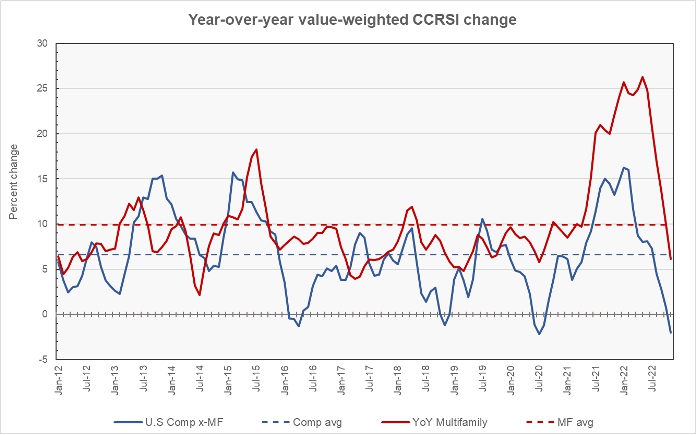
The chart shows that the year-over-year rate of increase in multifamily property prices is now below its 10-year average. The rate of year-over-year increase for non-multifamily commercial property prices has now been below its 10-year average for four months in succession.
The average rate of year-over-year growth for multifamily property prices has been 9.9 percent since January 2012. The average rate of year-over-year growth for other commercial property prices has been 6.7 percent since January 2012, well above the November figure.
For comparison, MSCI Real Capital Analytics reports that the average annual increase in multifamily property prices has been 11.1 percent while that of other commercial property has been 8.4 percent.
Transaction volumes continue to fall
The preliminary number of transactions reported for November was down 19.5 percent from the revised level of the month before. The preliminary dollar volume of transactions was also down, falling 15.3 percent. However, compared to the preliminary numbers reported last month, the number of transactions in November was down only 6.7 percent and the dollar volume of transactions was down only 5.6 percent. This is because CoStar identified additional transaction pairs for the month of October since the preliminary results for October were reported last month.
The following chart gives a history of the last 6 months of reports for the number of transactions for each month since June. Looking at the group of 6 vertical bars for June, the leftmost bar shows the number of transactions first reported for June in the CoStar CCRSI report issued in July. Each subsequent bar shows how the number was revised in the following monthly reports. The rightmost of the bars for June shows the transaction count listed for that month in CoStar’s CCRSI report released in December.
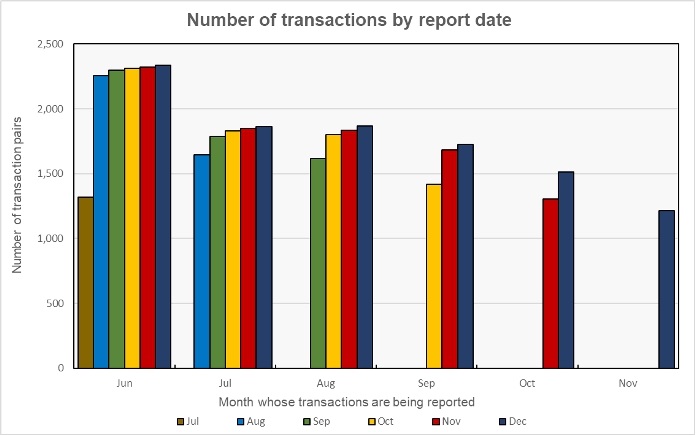
The two bars shown for October illustrate how the number of identified transaction pairs increased from last month’s report to this month’s report. While the current trend appears to be for the number of transactions occurring each month to fall, comparing the second reading for October to the first reading for November may give an over-estimate for the size of the fall.
The full report discusses all commercial property types. While the CoStar report provides information on transaction volumes, it does not break out multifamily transactions. The latest CoStar report can be found here.
CCRSI defined
The CoStar report focuses on a relative measure of property prices called the CoStar Commercial Repeat Sales Index (CCRSI). The index is computed based on the resale of properties whose earlier sales prices and sales dates are known. The index represents the relative change in the price of property over time rather than its absolute price. CoStar identified 1,216 repeat sale pairs in November for all property types. These sales pairs were used to calculate the results quoted here.
CoStar computes CCRSI’s for a variety of property groupings, combining them by cost, region, property type or other factors. The value-weighted index is more heavily influenced by transactions of expensive properties than is CoStar’s equal-weighted index. The value-weighted index is the focus of this report because it is an index whose value is reported monthly and for which CoStar breaks out multifamily property as a separate category.


