

The latest commercial property price report from MSCI Real Capital Analytics said that multifamily property prices fell 1.9 percent in December from their level of the month before. For the second month in succession, this was the largest month-over-month decline for any of the commercial property types tracked in the report. Multifamily property prices were reported to be up only 1.8 percent year-over-year. The year-over-year multifamily property price growth rate is down from that initially posted last month, marking the 10th month in a row of declining year-over-year price growth.
Defining CPPI
MSCI tracks an index called the Commercial Property Price Index (CPPI). The index is computed based on the resale prices of properties whose earlier sales prices and sales dates are known. The index represents the relative change in the price of property over time rather than its absolute price. Note that, as properties are added to the MSCI dataset each month, they recalculate the CPPI all the way back to the beginning of the data series.
Industrial is bright spot
Prices for all commercial property as a single asset class rose only 0.9 percent year-over-year in December. Prices for all commercial property as a single asset class fell by 1.2 percent from the level of the previous month.
Price appreciation for industrial properties was 0.5 percent for the month. It was the only property class to achieve positive price growth for the month. Industrial property prices rose 12.2 percent over the past 12 months.
The poorest performing CPPI for a property type on a year-over-year basis was that for offices within central business districts (CBD). This index was down 0.4 percent for the month and down 2.1 percent for the year. The CPPI for retail properties was down 0.5 percent for the month but up 3.1 percent for the year.
Multifamily leads, but not in a good way
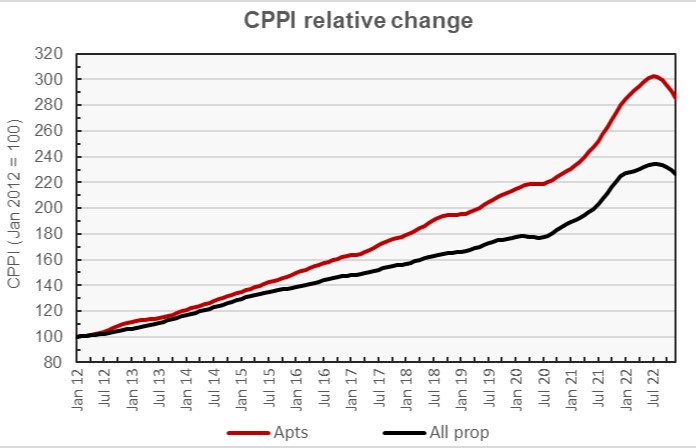
The first chart, below, shows how the CPPI’s for all commercial property and for apartments have changed since January 2012. To simplify the comparison, both CPPI’s have been normalized to a value of 100 in January 2012. The chart shows that the price indexes first dipped and then surged in response to the COVID pandemic. However, prices for both property classes peaked in July 2022 and have been declining since then.
The next chart plots the year-over-year changes in the values of the CPPIs since January 2012 for all commercial property as a single asset class and for apartments. The chart shows that the year-over-year rate of price increases for both property classes peaked in February 2022 and is now on the verge of going negative.
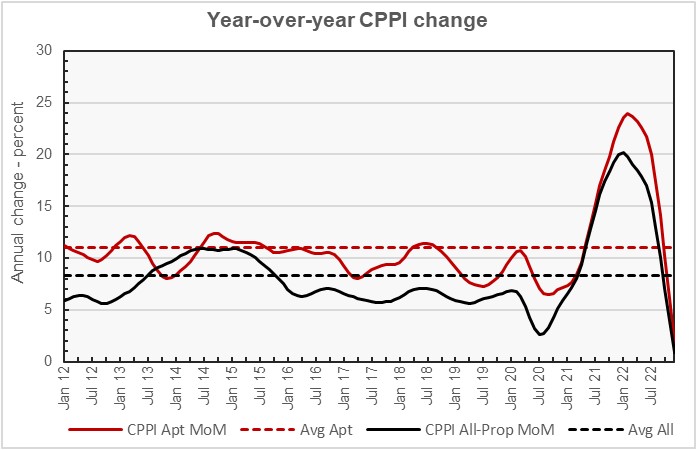
The chart also shows the average rates of annual appreciation in the indexes for the two property classes. The average annual appreciation for apartments since January 2012 is 11.0 percent, while the average annual appreciation rate for all commercial property as a single asset class is 8.3 percent.
The MSCI report also includes information on sales momentum for certain commercial property segments. It breaks the multifamily segment into garden and mid-rise/high-rise segments. It found that sales volume was down for the two multifamily segments by 18 percent and 15 percent respectively. However, it found that the garden segment maintained positive price growth with a 4 percent rise year-over-year. In contrast, prices in the mid-rise/high-rise segment fell 3 percent year-over-year.
Major metros continue to lag
The MSCI report provides data comparing the price changes of commercial property in 6 major metro* areas against those in the rest of the country, although it does not separate out apartments from other commercial property types in this comparison.
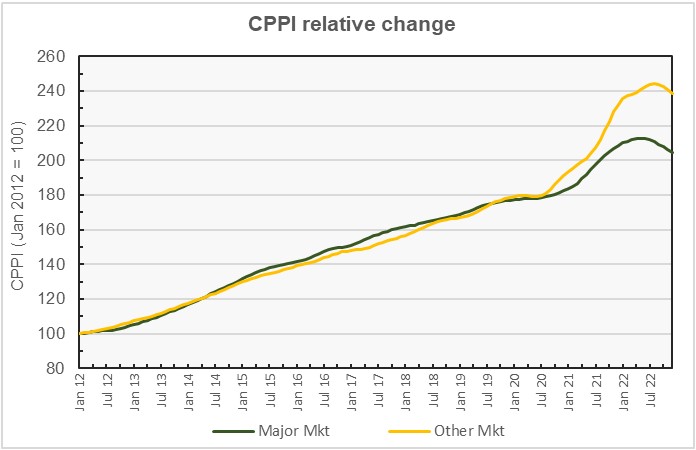
The next chart, below, plots the history of the price indexes since January 2012 for both market segments. It shows that the growth in the two price indexes was very similar until 2021 when commercial property price appreciation in the non-major markets became significantly higher than that in major markets, although prices also rose in the major metros. Currently, cumulative price appreciation in non-major markets since January 2012 is 16.8 percent higher than that in major metros.
The final chart plots the history of the year-over-year change in the price indexes for the two property markets since January 2012 along with the average rates of price appreciation for the two market segments for the period between January 2012 and December 2019.
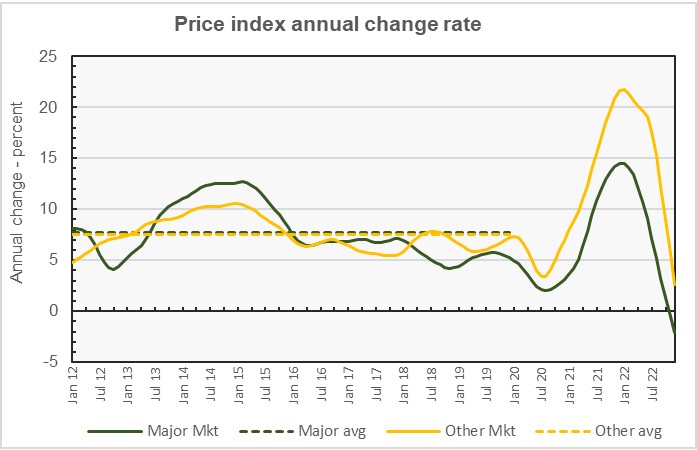
The chart shows how the rates of year-over-year price appreciation diverged during the pandemic. It also shows the same surge then sink response to the pandemic as we saw for apartments. The rates of year-over-year price appreciation for both segments are now in or headed for negative territory.
By the numbers, price appreciation for commercial property in major metros was reported to be -0.8 percent for the month and -2.1 percent for the year. Price appreciation for commercial property in non-major markets was reported to be -1.0 month-over-month and +2.6 percent year-over-year. The average rates of price appreciation from 2012 through 2019 are 7.7 percent for major metros and 7.5 percent for non-major markets.
The full report provides more detail on other commercial property types. Access to the MSCI report can be obtained here.
*The major metros are Boston, Chicago, Los Angeles, New York, San Francisco and Washington DC.


