

A Mortgage Bankers Association (MBA) report shows that the government sponsored entities (GSEs), Fannie Mae and Freddie Mac, accounted for most of the growth in multifamily mortgage debt holdings in Q4 2022.
The MBA reported that multifamily mortgage debt outstanding rose by $35.6 billion in Q4, slightly less than in Q3. Total multifamily mortgage debt reached a level of $1.925 trillion. Compared to the year-earlier level, debt was up $150 billion (8.3 percent).
The total of all commercial mortgage debt, including multifamily debt, outstanding at the end of Q4 rose 1.7 percent from its Q3 2022 level to $4.532 trillion. Multifamily mortgage debt represented 43.2 percent of commercial mortgage debt outstanding.
Earlier, the MBA had reported that multifamily mortgage originations had dropped sharply in Q4, with the Q4 2022 originations index reported to be down 52 percent from the level of the index in Q4 2021.
Ranking the lenders
The shares of multifamily mortgage debt held by various classes of lenders are shown in the first chart, below.
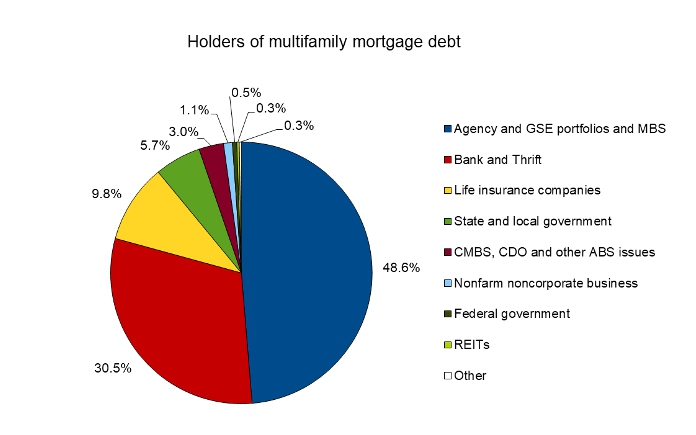
Of the increase in mortgage debt outstanding in the quarter, $27.3 billion, or 77 percent, was held by “Agency and GSE portfolios and MBS”. These are agencies, like the Federal Housing Administration and Government Sponsored Enterprises like Fannie Mae and Freddie Mac, who buy up mortgages and sell some of the debt as Mortgage-Backed Securities (MBS). At the end of Q4, the GSEs’ holdings of multifamily mortgage debt rose to 48.6 percent of the total outstanding. Prior to last quarter, the GSEs’ share of this debt had been trending lower since it reached 50.1 percent in Q1 2021. The current rebound is similar to what happened during 2020 when the GSEs continued to grow their portfolios of mortgages even as pandemic related uncertainty caused other classes of lenders to pull back.
Banks and Thrifts, the second largest holders of multifamily mortgages, increased their holdings by $14.3 billion in Q4, down from growth of $26.6 billion in Q3. This represented 40 percent of the increase in multifamily mortgage debt outstanding. Note that the shares of the growth for the GSEs and for banks and thrifts taken together add up to more than 100 percent. This is because some other classes of lenders reduced their holdings of mortgages during the quarter, some of them significantly. Banks and thrifts increased their share of multifamily debt to 30.5 percent in Q4.
Life Insurance companies increased their direct holding of multifamily mortgage debt by $2.0 billion in the quarter, raising their holdings to $191.3 billion. Their share of total multifamily debt outstanding remained steady at 9.8 percent in the quarter. However, this figure does not account for the multifamily mortgages these companies hold through commercial mortgage-backed securities (CMBS).
While the three largest categories of lenders listed above increased their holdings of debt in Q3, 5 of the 9 other categories of lenders identified in the report reduced their holdings.
State and local governments held 5.7 percent of outstanding multifamily mortgage debt at the end of Q3. They increased their holdings by $900 million to a total of $112.3 billion at the end of the quarter.
CMBS, CDO (collateralized debt obligations) and other ABS (asset backed securities) issuers decreased their holdings of multifamily mortgage debt in Q3 by $8.1 billion, by far the largest decline of any of the lender classes. Their share of debt outstanding fell to 3.0 percent.
The largest decline in multifamily mortgages holdings on a relative basis was for REITs, whose holdings fell by 13.6 percent in the quarter. REITs now hold 0.3 percent of debt outstanding.
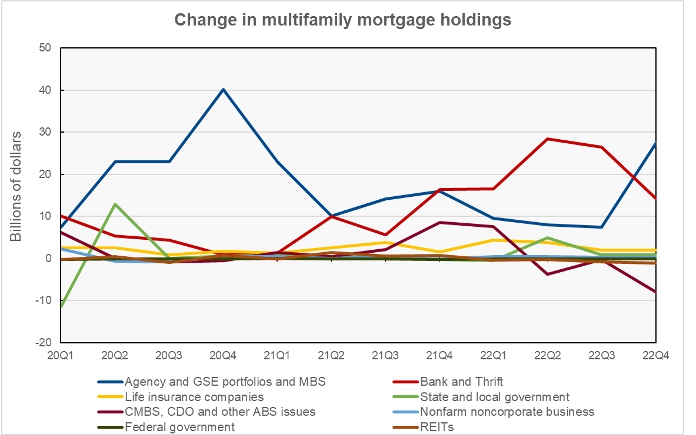
The next chart, below, shows the quarterly changes in multifamily mortgage holdings of the 8 largest classes of lenders since Q1 2020. It shows that banks were recently the dominant source for net increased multifamily lending, taking over from the GSEs who dominated during the pandemic. However, Q4 marks a return to the pandemic pattern where the GSEs step in as other lenders step back.
Who’s growing their share?
The next chart, below, plots the current share of multifamily mortgage debt outstanding for a given class of lender alongside that class of lender’s share of net new mortgage debt outstanding in Q4. When the latter share is greater than the former, that class of lender is increasing its share of the multifamily mortgage market.
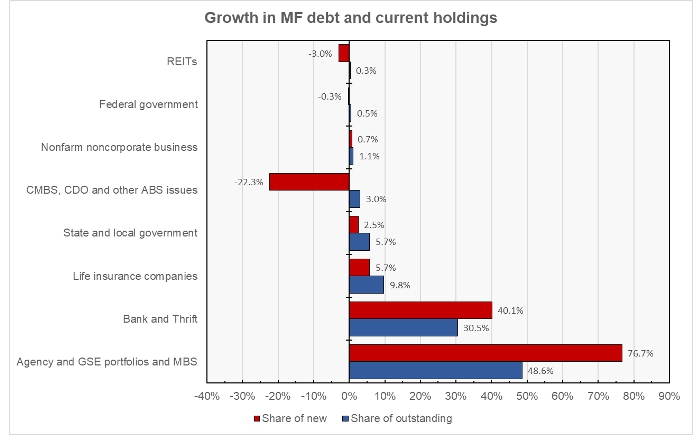
The chart shows that the GSEs increased their net holdings at a rate well above their share of current holdings, increasing their relative share of multifamily mortgage debt outstanding. Banks also increased their share despite seeing a lower dollar value growth in holdings than in the prior quarter. Other lender types reduced their relative holdings of mortgages, CMBS, CDO and ABS issuers aggressively so.
The report does not cover loans for acquisition, development or construction, or loans collateralized by owner-occupied commercial properties. The full report also includes information on mortgage debt outstanding for other commercial property types. The full report can be found here.


