

The latest rent report from Apartment List shows that the national average monthly rent growth in March was a positive 0.5 percent, up slightly from last month’s increase and the second positive month in a row after a string of months where rents declined. Year-over-year rent growth was 2.6 percent, in line with pre-pandemic levels. Apartment List reported the national average apartment rent to be $1,350.
Rent history
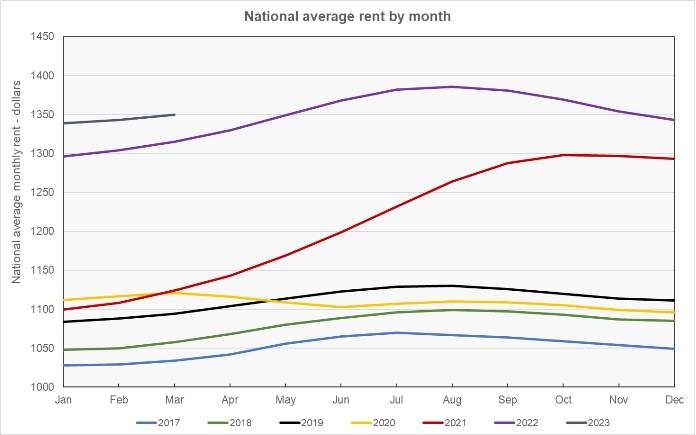
The first chart shows the history of the national average rent level since 2017. It is plotted year-by-year so that the annual change pattern is visible.
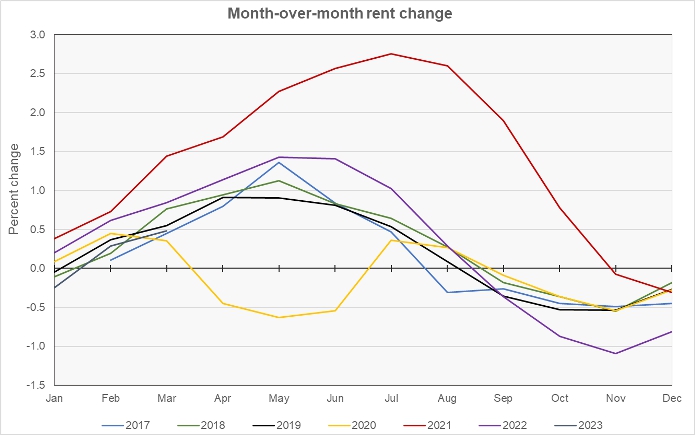
The next chart shows the month-over-month rent growth rate for all of the years in the Apartment List data set. It shows that the rent growth pattern so far in 2023 is in line with what was seen in the pre-pandemic years, although it is on the low end of the range.
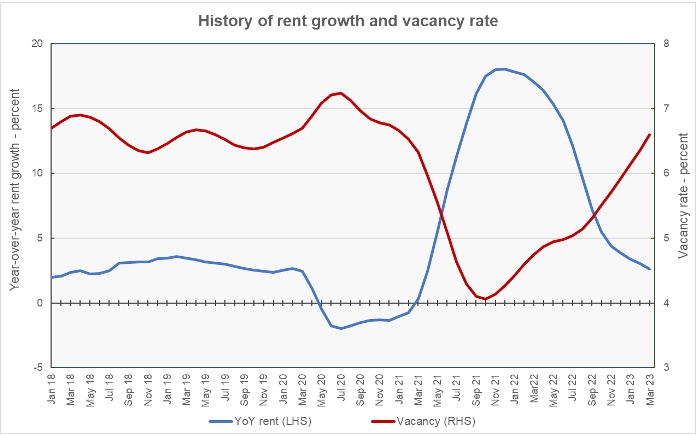
The final chart shows the year-over-year rate of rent growth since January 2018 plotted along with the national average apartment vacancy rate. The current vacancy rate is 6.6 percent, matching the average rate for the period from January 2018 through January 2020. The current year-over-year rent growth rate is 2.6 percent while the average rate for the period from January 2018 through January 2020 is 2.8 percent. While the two curves show these metrics returning to their “normal” ranges, the trajectories of the curves plotting these two metrics do not suggest that they are settling in around those levels.
Leaders and trailers
Apartment List provides the underlying data they collected in compiling their report and that data was used to create the tables, below. The tables look at the 50 most populous metropolitan statistical areas defined by the US Census Bureau and identify the top and bottom 10 metros for year-over-year rent growth. The tables provide the average monthly rent in the metro, the metro’s vacancy rate, the annual percentage change in rent (YoY Metro) along with the percentage change from the prior month’s rent level (MoM Metro). They also list the percentage change in rent for the metro area compared to the rent level in February 2020, right before the pandemic struck (Feb 20).
The first table shows the 10 metros with the largest annual rent percentage increases. Many of these metros are centered around midwestern cities that don’t often appear at the tops of lists for rent growth leaders.
| Metro | Metro Rent | Vacancy | YoY Metro | MoM Metro | Feb 20 |
| Chicago | $1,392 | 5.3 | 6.3 | 1.38 | 15.2 |
| Indianapolis | $1,180 | 6.1 | 6.2 | 0.16 | 27.4 |
| Cincinnati | $1,128 | 8.3 | 6.0 | 0.48 | 26.7 |
| Louisville | $1,059 | 7.0 | 5.8 | 1.08 | 17.7 |
| Boston | $1,932 | 7.2 | 5.7 | 1.67 | 15.6 |
| Columbus | $1,232 | 5.0 | 5.7 | 0.60 | 22.2 |
| Oklahoma City | $1,112 | 6.6 | 5.6 | (0.09) | 26.7 |
| Kansas City | $1,192 | 8.4 | 5.6 | 0.58 | 19.2 |
| Hartford | $1,472 | 7.3 | 5.1 | 0.38 | 24.0 |
| St Louis | $1,117 | 5.5 | 4.5 | 0.63 | 17.2 |
The next table shows the 10 metros with the smallest annual rent increases.
| Metro | Metro Rent | Vacancy | YoY Metro | MoM Metro | Feb 20 |
| Phoenix | $1,577 | 5.6 | (3.3) | (0.18) | 29.5 |
| Las Vegas | $1,497 | 5.4 | (3.0) | 0.16 | 28.7 |
| Sacramento | $1,704 | 7.3 | (2.6) | (0.20) | 20.5 |
| New Orleans | $1,195 | 9.2 | (1.5) | 0.55 | 16.0 |
| Riverside | $1,929 | 4.4 | (0.7) | 0.85 | 33.3 |
| San Francisco | $2,085 | 5.9 | (0.6) | 0.29 | (3.7) |
| Detroit | $1,129 | 6.2 | (0.2) | 0.58 | 16.8 |
| Salt Lake City | $1,449 | 4.8 | (0.1) | (0.28) | 27.0 |
| Atlanta | $1,536 | 6.7 | 0.2 | 0.29 | 26.2 |
| Memphis | $1,224 | 7.3 | 0.6 | 0.00 | 28.0 |
Looking for differences between the metros on the two lists, the thing that stands out is that the average rent charged in the metros where rents are now growing the fastest is lower than the average rent charged in the low rent growth metros. The average rent for the high rent growth metros is $1,282 per month, while the average rent charged in the low rent growth metros is 20 percent higher at $1,533 per month.
Perhaps unexpectedly, the average vacancy rate in the high rent growth metros is higher, at 6.7 percent, than the 6.2 percent average vacancy rate in the low rent growth metros. The average rent growth since February 2020, before COVID struck, is nearly the same for the two groups of metros at 21.2 percent for the high rent growth metros versus 22.2 percent for the others.
The complete Apartment List report covers many more metros. It also provides readers with the opportunity to download their data sets. The latest report can be found here.


