

The Census Bureau’s report on construction spending shows that the value of multifamily residential construction put in place in January was up 0.4 percent month-over-month. Spending on single-family fell for the 9th month in a row while spending on improvements managed a small increase.
Multifamily value remains stable
The reported value of total private residential construction put in place in January 2023 was $847.4 billion on a seasonally adjusted, annualized basis. This figure, which includes spending on both new construction and on improvements, was reported to be down $4.8 billion from December’s revised figure despite December’s spending being revised downward by $5.0 billion in this month’s report. Residential construction spending in January was down 3.9 percent year-over-year.
The value of new private construction of multifamily residential buildings put in place in January was reported to be $120.5 billion on a seasonally adjusted, annualized basis. This was up $472 million from the revised (-$265 million) level for December. The value of multifamily housing construction put in place in January 2023 was 20.6 percent higher than the level of January 2022.
By comparison, the Census Bureau’s New Residential Construction report said the number of unit completions in January in buildings with 5 or more units was down 9 percent for the month but up 14 percent year-over-year.
State and local governments were reported to have put $9.6 billion in residential construction in place in January on a seasonally adjusted annualized basis.
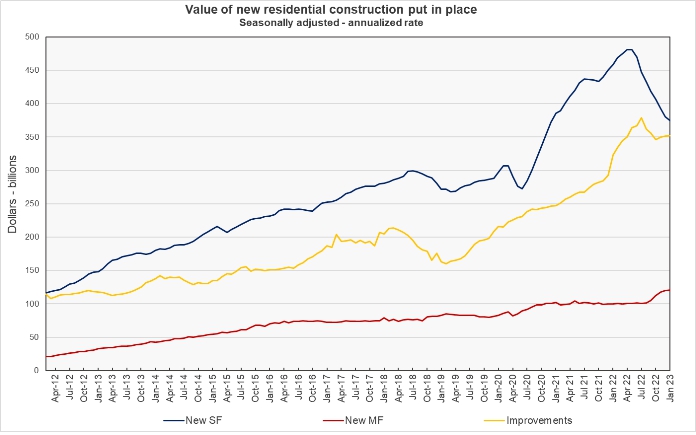
The value of new single-family residential construction put in place in January was $374.4 billion on a seasonally adjusted, annualized basis. This was down $6.3 billion (1.7 percent) from the revised (-$3.7 billion) level for December and was down 18.4 percent from the level of January 2022.
The value of improvements to residential buildings put in place in January was reported to be $352.4 billion on a seasonally adjusted, annualized basis. This was up 9.0 percent from the year-earlier level and was up 0.3 percent from the revised (-$1.0 billion) level for December. The Census Bureau does not separate out improvements for single-family and multifamily residential buildings.
Charting the data
The following chart shows the value of residential construction put in place each month since January 2012. The chart illustrates that the value of single-family residential construction put in place has fallen steadily since peaking in April 2022. New multifamily residential construction spending had a jump recently after being essentially flat since mid-2020. This month’s results may indicate that it is flattening out again, although at a higher level.
The report from the Census Bureau also includes information on spending on other types of construction projects. The full report can be found here.


