The “Week 56” edition of the Census Bureau’s Pulse Survey shows that the portion of renters with rent delinquencies rose to 13.1 percent, up from the 12.4 percent reported in the Week 55 survey but down from the 14.2 percent reported in the Week 54 survey.
The Week 56 survey collected data from March 29 to April 10, 2023.
Delinquencies find their range
Renters in all phases of the Pulse survey have been asked whether they are behind on their rent. The first chart, below, shows the portion of respondents who said that they were behind at the time they were surveyed. Note that the midpoint of the “Week 56” survey period was April 4, 150 weeks after the initial Pulse Survey. This survey period spanned the end of one month and the start of the next.
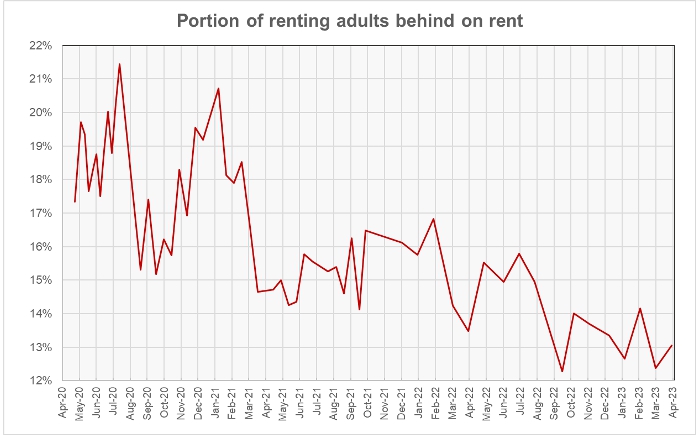
The portion of renters who pay rent (about 5 percent do not) reporting that they were delinquent rose 0.7 percentage points between the Week 55 and Week 56 surveys. Ever since the Week 50 survey in late September 2022, the portion of renters saying that they are behind on their rent has varied between 12.4 percent and 14.2 percent, so this may be the natural range for this response.
Tracking rent growth
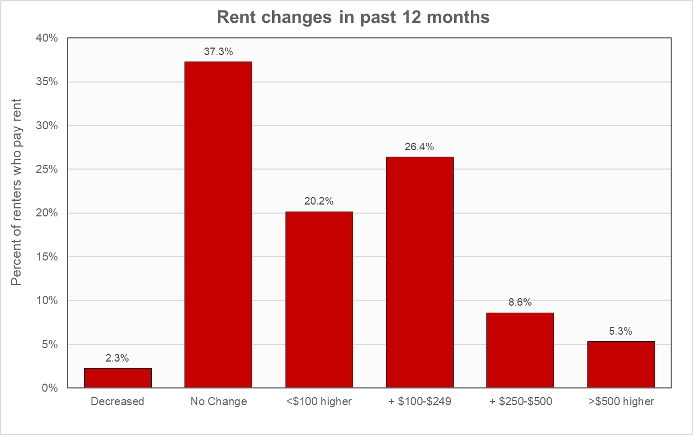
The survey asked participants whether they had experienced rent increases over the past 12 months. In the Week 56 survey, 39.6 percent of respondents who pay rent said that they either had not experienced a rent increase in the past 12 months or that their rent had gone down. This is a decrease of 4.2 percentage points since the Week 55 survey. An additional 20.2 percent had experienced a rent increase of less than $100. These results are shown in the next chart, below.
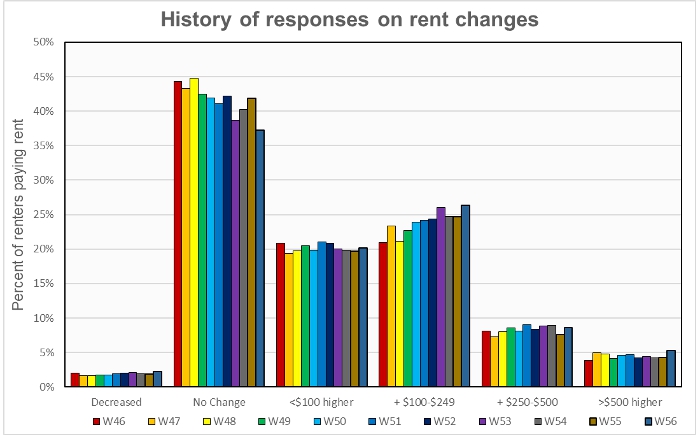
The question about the size of rent increases over the past 12 months has been asked since the Week 46 survey. The next chart gathers all of the answers to this question together to look for trends. Despite the increase in the Week 55 survey, the chart shows a general trend of a decline in the portion of renters who have had no change in their rent. The portion of renters experiencing rent increases of $100 to $249 has been trending higher. No clear trend is seen for the other categories of rent changes.
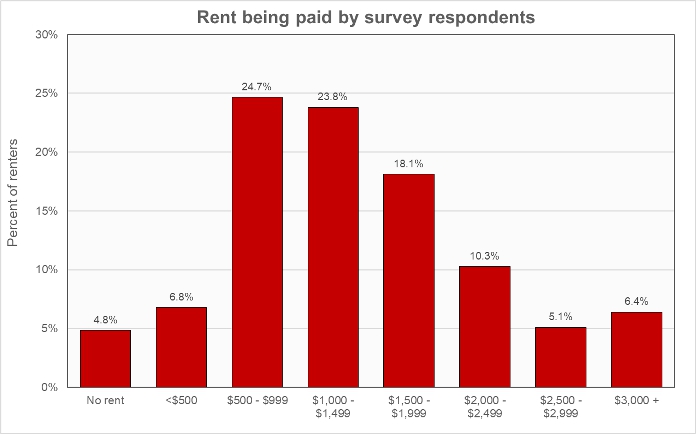
The next chart shows the distribution of rents paid by survey respondents. The data show that 36.3 percent of renters are paying less than $1,000 per month for their housing while 39.9 percent are paying more than $1,500. These figures compare to national average apartment rents of $1,350 from Apartment List and $1,702 from Yardi Matrix.
Profiling the participants
Of the respondents who reported being current on their rent, 34.5 percent said that they had children in the household. Of those reporting being behind on their rent, 60.7 percent reported having children in the household.
Of the respondents who reported being current on their rent, 13.9 percent said that they or a household member had experienced a loss of employment income over the prior 4 weeks. Of those reporting being behind on their rent, 33.6 percent reported that they or a household member had experienced a loss of employment income.
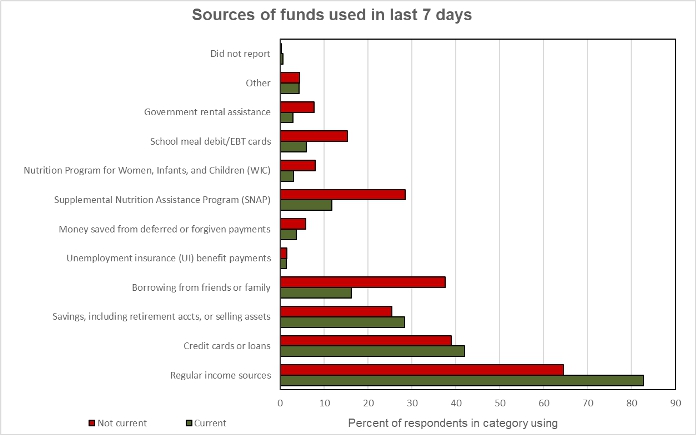
The final chart shows the sources of the funds survey respondents used to meet spending needs. Compared to the Week 50 survey taken about 6 months ago, respondents in Week 56 were more likely to rely on regular income sources for their support and are less likely to draw upon their savings.
What is the Pulse Survey?
The Pulse Survey is an experimental program that the Census Bureau started shortly after economic shutdowns were imposed in response to COVID-19. It was designed to assess how the population of the country was faring under the economic stress caused by the reaction to the pandemic. The current survey, designated Week 56 despite being conducted 4 weeks after the Week 55 survey, was collected under what Census calls Phase 3.8 of the survey. With each new phase of the survey, Census modifies the set of questions being asked. The renter portion of the survey covers renters of both multifamily and of single-family properties.


