

Yardi Matrix reported that national average apartment rent increased $3 in March to $1,702 per month. This follows two months where Yardi Matrix had reported no rent growth.
Year-over-year rent growth slide continues
The national average asking apartment rent was up 4.0 percent in March from its year-earlier level. This rate of increase was down 0.8 percentage points from that reported last month. This continued the trend of a flat or declining rate of year-over-year rent growth which has been underway since rent growth peaked in February 2022.
Rents in the “lifestyle” asset class, usually Class A properties, rose 2.3 percent year-over-year, while rents in “renter by necessity” (RBN) properties increased by 5.9 percent year-over-year. Both rates are once again lower than those reported for the prior month. The chart, below, shows the history of the year-over-year rent growth rates for these two asset classes along with the difference between these rates.
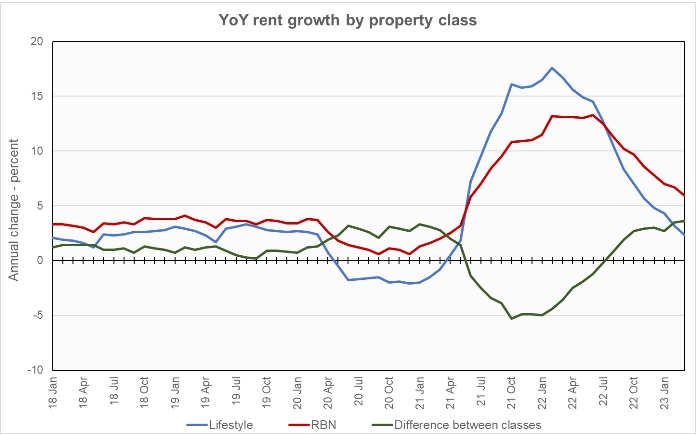
The chart shows that the year-over-year rent growth rate for lifestyle properties has been trending downward sharply and is now slightly below its average for 2018 and 2019. The year-over-year rent growth rate for RBN properties has also been trending lower but it is still 70 percent higher than its average for 2018 and 2019.
The national average lease renewal rate was 63.9 percent January, down slightly from December’s level. Year-over-year rent growth for leases that were renewed was 9.3 percent in January, up slightly for the month. This remains well above the 4.0 percent rent growth rate for new leases, but Yardi Matrix expects these rates to converge over the course of the year.
Yardi Matrix reported that U.S. average occupancy rate fell slightly to 95.1 percent in February, 1.1 percentage points lower than its rate at the start of the year.
Yardi Matrix also reported that single-family rental (SFR) rents rose $5 in March to a level of $2,079 per month. The year-over-year SFR rent growth rate fell to 2.8 percent. The national occupancy rate for single-family rentals slipped 0.1 percentage points from the revised level of the month before to 95.5 percent in February. Occupancy was down 0.6 percentage points from its level one year ago.
Rent growth and more
Yardi Matrix reports on other key rental market metrics in addition to rent growth. These include the average rent to income ratio, the rent growth rate for residents who renew their leases and the portion of residents who do renew. The metro averages are included in the tables below, but the report also includes the rent to income ratios for both lifestyle and for RBN properties.
Of the top 30 metros by population, the 10 with the largest annual apartment rent increases as ranked by Yardi Matrix are given in the table, below, along with their annual percentage rent changes, overall rent to income ratio, rent growth for renewed leases and renewal rate for the month. The data on asking rent growth is for March. The other data is for February.
| Metro | YoY asking rent growth % | Rent to income ratio % | YoY renewal rent growth % | Monthly lease renewal rate % |
| Indianapolis | 8.6 | 25.2 | 7.4 | 66.2 |
| Kansas City | 6.9 | 24.6 | 8.7 | 67.4 |
| New York | 6.9 | 29.1 | 16.1 | 55.3 |
| Boston | 5.8 | 27.9 | 8.0 | 61.0 |
| Chicago | 5.2 | 29.9 | 5.6 | 63.4 |
| Miami Metro | 5.2 | 27.0 | 16.7 | 67.1 |
| Portland | 4.7 | 29.7 | 7.6 | 60.6 |
| San Jose | 4.5 | 28.2 | 8.8 | 49.5 |
| Charlotte | 4.2 | 29.0 | 8.7 | 63.5 |
| Orlando | 4.2 | 33.0 | 12.1 | 66.2 |
The major metros with the smallest year-over-year apartment rent growth as determined by Yardi Matrix are listed in the next table, below, along with the other data as in the table above.
| Metro | YoY asking rent growth % | Rent to income ratio % | YoY renewal rent growth % | Monthly lease renewal rate % |
| Phoenix | (2.0) | 29.0 | 10.5 | 61.3 |
| Las Vegas | (1.8) | 30.1 | 9.7 | 62.3 |
| Austin | 1.0 | 25.9 | 12.8 | 57.7 |
| Atlanta | 1.1 | 29.4 | 7.9 | 65.1 |
| Sacramento | 1.5 | 42.9 | 6.9 | 57.0 |
| Orange County | 1.8 | 33.1 | 7.9 | 61.2 |
| Seattle | 1.8 | 28.5 | 6.4 | 58.5 |
| San Francisco | 2.2 | 29.1 | 4.2 | 50.3 |
| Inland Empire | 2.4 | 31.0 | 10.3 | 54.5 |
| Tampa | 2.5 | 30.8 | 10.8 | 62.2 |
The top metros for month-over month rent growth in March were Boston, Indianapolis and Washington D.C. Twenty-two of the 30 metros tracked saw positive rent growth for the month, up from only 9 last month. The metros with the lowest month-over-month rent growth were Phoenix, Orange County and Atlanta. An indication of the volatility of this metric is that none of the top three metros for rent growth were in the top three last month and none of the bottom three metros were in the bottom three last month.
Bank health weighs on multifamily
The discussion section of this month’s report describes how concerns about multifamily financing have shifted from worrying about the impact of interest rate hikes to worrying about the impact of the declining health of banks. Banks are the second largest source of funds for multifamily property financing and so any pullback on their part would have a major impact on the availability and pricing of multifamily mortgage debt.
The change in market conditions has already caused commercial loan terms to become less favorable, with higher interest rates and lower leverage. This may cause issues for properties needing to refinance their loans.
The report suggests that, if banks step back from lending, it will create opportunities for other, non-bank, lenders. It remains to be seen whether they will take up this opportunity and at what price.
SFR rent up despite occupancy decline
Yardi Matrix also reported on the top 34 metros for single family rentals. This month, 24 of the 34 metros covered saw positive year-over-year rent growth, matching last month’s count. The leading metros for year-over-year rent growth were Nashville, Baltimore and Chicago.
This month, 6 of the metros saw year-over-year SFR occupancy increases. These metros were Sacramento, Raleigh, Atlanta, Miami, Detroit and Pittsburgh. Washington D.C, Austin and Seattle saw the greatest SFR occupancy declines. The year-over-year occupancy decline in Washington D.C. was again over 10 percent.
The complete Yardi Matrix report provides information on some of the smaller multifamily housing markets. It also has more information about the larger multifamily markets including numbers on job growth and completions of new units. It includes charts showing the history of rent changes in 18 of the top 30 markets over the last 4 years. It can be found here.


