Fannie Mae’s May economic and housing forecast reduces the depth of the predicted downturn in multifamily housing starts. It also delays the start of the downturn but leaves the timing of the recovery largely unchanged.
Multifamily starts downturn smaller
The current forecast for multifamily housing starts is shown in the first chart, below, along with three other recent forecasts. Fannie Mae considers any building containing more than one dwelling unit to be “multifamily”, including both condominiums and rental housing units.
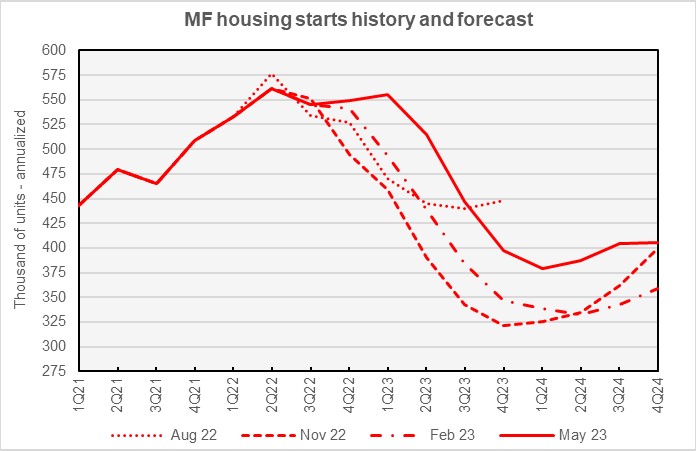
The current forecast calls for the lowest annualized rate of multifamily housing starts (2+ units per building) to be 379,000 units in Q1 2024. While this leaves the predicted timing of the low point in multifamily starts unchanged from last month’s forecast, the annualized number of starts was revised upward by 19,000 units.
Compared to last month’s forecast, the May forecast calls for more multifamily hoousing starts in every quarter of 2023 and 2024, the second monthly forecast in a row where this has been the case. Fannie Mae now expects multifamily starts for 2023 to come in at 478,000 units, up 24,000 units from the level forecast last month. The forecast for 2024 is 394,000 units, up 22,000 units from last month’s forecast.
The current forecast for single-family housing starts is shown in the next chart, below, along with three other recent forecasts.
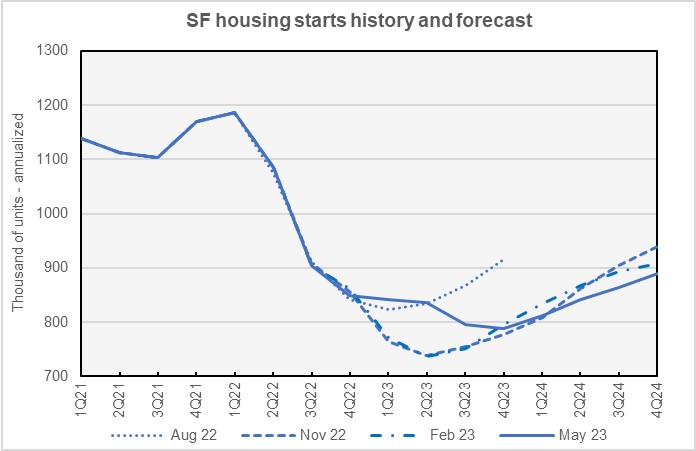
Compared to last month’s forecast, Fannie Mae’s forecasters raised their predicted numbers for single-family starts in every quarter of 2023. However, their starts forecasts for Q2 and Q3 of 2024 were revised marginally lower. As in last month’s forecast, they expect the low point in single-family housing starts to occur in Q4 2023, but they revised the expected minimum annualized number of starts higher by 19,000 units to 789,000 units. Fannie Mae’s forecasters expect single-family starts to trend higher in 2024.
Fannie Mae now expects single-family starts to be 815,000 units in 2023, up 36,000 units from the level forecast last month. Fannie Mae’s lowered their forecast for single-family starts in 2024 by 1,000 units to a level of 852,000 units.
GDP downturn comes later
The next chart, below, shows Fannie Mae’s current forecast for Gross Domestic Product (GDP) growth, along with three other recent forecasts.
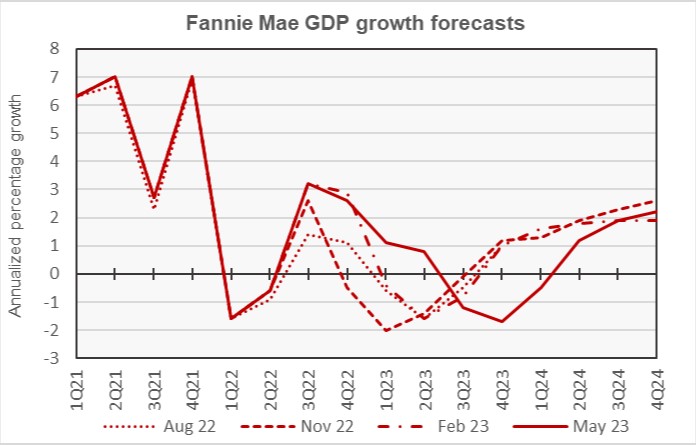
Fannie Mae’s forecasters have slightly delayed the date of the expected recession compared to recent forecasts. They now expect the first quarter of negative GDP growth to be Q3 2023, one quarter later than in last month’s forecast. Interestingly, this is the same quarter in which they expected the recession to begin in their April 2022 forecast, the first one in which they predicted a recession. Negative GDP growth is still expected to persist through Q1 2024 but the recovery in GDP is expected to be more gradual than that predicted last month.
The full year forecast for GDP growth for 2023 was revised upward by 0.1 percentage point to -0.3 percent. The full year forecast for GDP growth in 2024 was revised downward by 0.2 percentage points to +1.2 percent. Both of these changes reverse last month’s revisions.
Inflation hangs on
The next chart, below, shows Fannie Mae’s current forecast for the Consumer Price Index (CPI), along with three other recent forecasts.
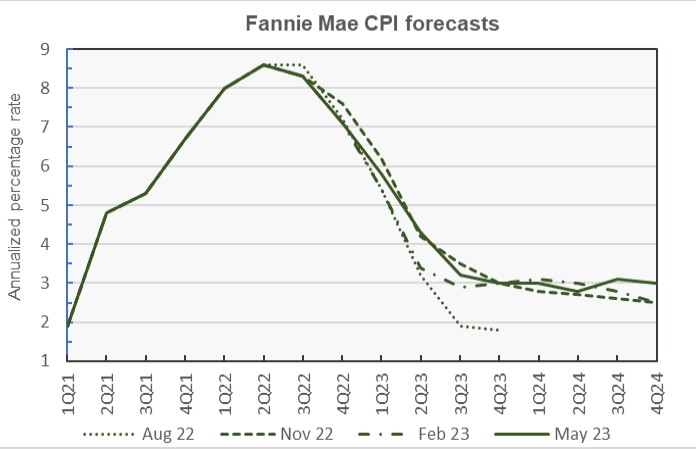
The current Fannie Mae inflation forecast predicts the highest rate of CPI inflation for Q4 2024 of any of their forecasts that have provided predictions for 2024, with a predicted rate of 3.0 percent. However, the forecast predicts that CPI inflation will first fall to 3.0 percent in Q4 2023, meaning that they predict that the Federal Reserve will be able to get inflation close to their desired range in 2023 but will struggle to achieve the last percentage point or so of inflation reduction.
Looking at whole-year forecasts, the forecasts for year-over-year CPI growth in Q4 2023 was revised downward from last month’s level by 0.3 percentage points to 3.0 percent. The Q4 2024 inflation rate was revised upward by 0.3 percentage points to 3.0 percent.
Employment growth: lower later
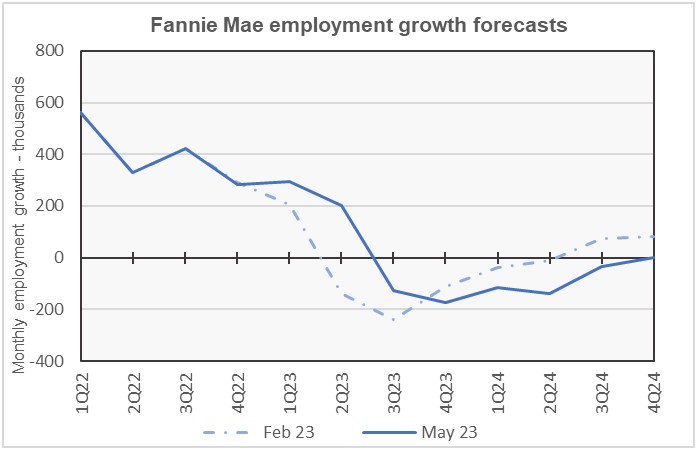
The next chart, below, shows Fannie Mae’s current forecast for the employment growth, along with another recent forecast.
Employment growth is our preferred employment metric since jobs drive economic growth. The issue with the unemployment rate is that it is affected by the labor force participation rate. The unemployment rate falls when people drop out of the labor force, but this would not be a sign of a strong economy. However, the population basis for reporting employment numbers was revised in February 2023, so employment data in the February and later forecasts were not comparable to that in earlier forecasts. Therefore, we have recently been reporting on the unemployment rate rather than on employment growth. With the May Fannie Mae forecast, we now have enough employment growth data based on the new population estimates that we can discuss trends. Because of this, we are returning our focus to the employment growth data.
Compared to the February forecast shown in the chart, Fannie Mae’s May employment growth forecast calls for the drop off in employment growth and the recovery in employment growth to occur later. This is consistent with the expectation for a later economic downturn as shown in the GDP forecasts.
Compared to last month’s forecast, the expected full year forecast for the employment growth 2023 was revised upward from a gain of 500,000 jobs to a gain of 600,000 jobs. The employment growth forecast for 2024 was revised upward from a loss of 1,000,000 jobs to a loss of 900,000 jobs.
Commentary looks at smaller multifamily properties
The Multifamily Economic and Market Commentary looked at the differences between the operation of smaller apartment buildings, which it defines as those having 5 to 51 units, and larger apartment buildings.
The commentary notes that smaller multifamily properties are more commonly located in smaller communities. However, the metro area with the most smaller properties is Los Angeles with 55,000 properties containing a total of 665,000 units. In second place is New York City with 46,000 properties followed by San Francisco-Oakland with 16,000 properties.
Since 2010, only about 17 percent more large multifamily properties have been completed than have smaller properties. However, by unit count, the new large multifamily properties have 10 times the units of the smaller properties.
Rents in smaller multifamily properties are about 20 percent cheaper than those in larger properties and recent rent growth for smaller properties has been lower. However, vacancy rates are lower in smaller properties and they have been less impacted by the recent rise in vacancy rates than have larger properties.
Dollar sales volume for smaller multifamily properties in 2022 was over 30 percent higher than that in 2019. Price per unit is also up from pre-pandemic levels, but recently cap rates have been rising. The commentary quotes MSCI as estimating cap rates for smaller multifamily properties at 5.2 percent while CoStar pegs them at 5.8 percent. In both cases, these rates are up about 11 percent since Q2 2022.
Banks are active in lending for smaller multifamily properties to a greater degree than is the case for multifamily lending overall. In 2022, the commentary says that banks provided 72 percent of financing for smaller multifamily properties. About 50 percent of financing was provided by smaller regional banks. The commentary suggests that these banks have maintained their share of the financing market for smaller multifamily properties despite rising economic uncertainty. It is the larger national and international banks that have reduced their share of lending to this market segment.
The Fannie Mae forecast can be found here. There are links on that page to the detailed forecasts and to the commentary.


