

The May producer price index (PPI) report from the Bureau of Labor Statistics (BLS) stated that construction materials prices fell 0.1 percent month-over-month, seasonally adjusted. The index of components and materials for construction was 0.2 percent lower than its year-earlier level.
Overall prices for processed goods for intermediate demand fell by 1.5 percent in the month as the price index for fuels and lubricants fell 6.9 percent. The processed goods for intermediate demand index was 7.1 percent lower than its year-earlier level.
For reference, the changes in these indices compare with a 4.0 percent rise in the all-items consumer price index (CPI-U) for the 12 months ending in May. The seasonally adjusted May CPI-U was up 0.1 percent from April’s level. The shelter portion of the CPI-U was up 0.6 percent for the month and was 8.0 percent higher than its year-ago level.
Yield Pro compiled the BLS reported changes for our standard list of construction materials prices. These are prices of materials which directly impact the cost of constructing an apartment building. The two right hand columns of the table provide the percent change in the price of the commodity from a year earlier (12 Mo PC Change) and the percent change in price from April (1 Mo PC Change). If no price data is available for a given commodity, the change is listed as N/A.
The pre-COVID column lists the change in the current construction materials prices relative to the average of prices from December 2019 through February 2020, before the pandemic impacted the economy. This may give a truer idea of the magnitude of the recent price increases for materials, such as lumber, whose prices were already rising sharply last year, than does the 12 Mo PC Change column.
| Commodity | 12 Mo PC Change | 1 Mo PC Change | Pre-covid Change |
| Softwood lumber | (40.4) | (0.3) | 21.0 |
| Hardwood lumber | (17.8) | 0.8 | 28.4 |
| General millworks | 2.7 | 0.0 | 29.7 |
| Soft plywood products | (27.4) | 0.2 | 70.9 |
| Hot rolled steel bars, plates and structural shapes | (9.3) | 2.7 | 64.0 |
| Copper wire and cable | (7.5) | (3.2) | 30.9 |
| Power wire and cable | 18.3 | (0.3) | 101.5 |
| Builder’s hardware | 4.6 | 0.0 | 25.5 |
| Plumbing fixtures and fittings | 3.2 | 0.1 | 17.7 |
| Enameled iron and metal sanitary ware | 0.7 | 4.0 | 21.5 |
| Furnaces and heaters | 2.2 | (1.0) | 34.0 |
| Sheet metal products | 0.1 | (1.6) | 44.6 |
| Electrical Lighting fixtures | 0.5 | 0.0 | 18.1 |
| Nails | (8.8) | (0.0) | 39.5 |
| Major appliances | 3.1 | 2.0 | 23.3 |
| Flat glass | 9.0 | (1.8) | 32.8 |
| Ready mix concrete | 12.9 | 1.1 | 28.2 |
| Asphalt roofing and siding | 3.0 | 0.8 | 36.6 |
| Gypsum products | 3.4 | (0.9) | 42.6 |
| Mineral wool insulation | 6.8 | (0.0) | 42.4 |
The first chart, below, shows the price index history for wood products over the past 37 months. Note that the prices used by the BLS in compiling the indexes are collected on the Tuesday of the week containing the 13th day of the month. In May that would have been May 9. In the June report, the data collection date will be June 13.
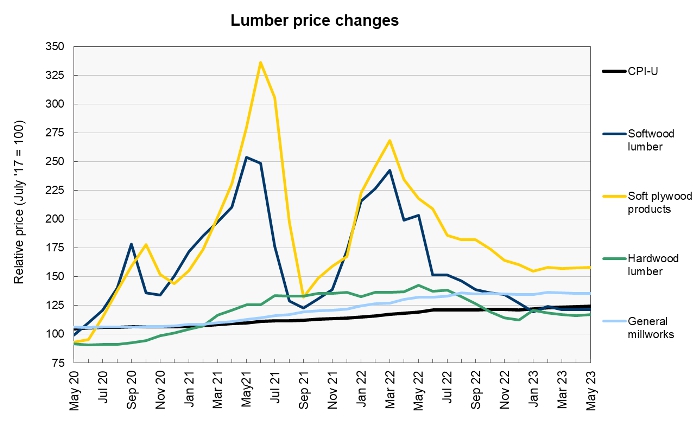
Although lumber prices have been very volatile in the post-COVID era, they have been relatively stable recently. None of the price indexes for the four lumber categories that we track moved as much as one percent for the month. They are generally down from the very elevated levels that they reached a year ago, but they have mostly fallen to middle of the pack for post-COVID price gains. The exception to this is plywood, which continues to have seen the second highest post-COVID price rise of the construction materials prices that we track.
Looking ahead, NASDAQ reported that the market price of lumber closed on May 9 at $511 and rose to $528 on June 13. However, it had fallen as low as $478 at the end of May. Lumber prices in the futures markets indicate that higher prices are expected ahead. The November 2023 contract closed on June 13 at $546.
The next chart, below, shows the recent history of several other construction materials prices. These are relatively simple commodities whose prices are strongly driven by those of the materials of which they are comprised.
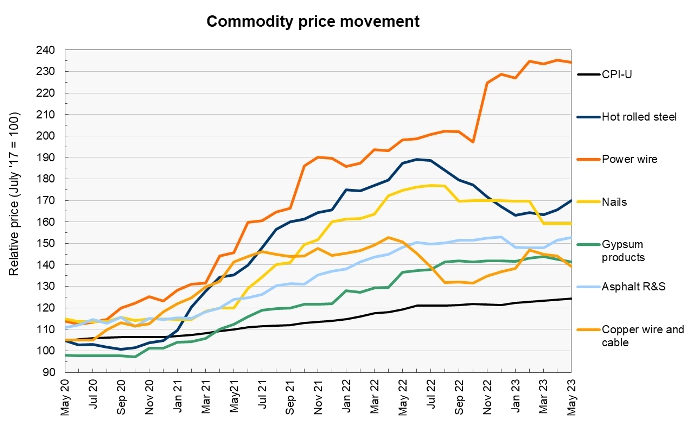
Power wire and cable remains the post-pandemic price rise leader. Its price has doubled from its level just before the pandemic emerged. However, its price has been relatively stable for the last four months and so have the prices of aluminum and copper as described below. By contrast, the price index for copper wire and cable had the largest monthly fall in the current report.
Hot rolled steel continues to occupy the number 3 spot on our list for post-pandemic price increases. It also saw the second highest reported monthly rise of the construction materials prices that we track. As described below, steel futures have been moving higher, indicating that more price increases may be in store.
Looking at prices for underlying materials, MarketWatch reports that the NYSE American steel index had been trending lower since early April but reversed course in June. It closed at $1,768 on May 9 but rebounded to $1,854 on June 13 after touching a low of $1,645 on May 31. Meanwhile, steel futures have been following a similar pattern with prices declining until the end of May when they started to rise again. The November 2023 contract closed 4.4 percent higher on June 13 than its level on May 9. The November 2023 contract was 7.4 percent higher on June 13 than on May 30.
The price of copper closed at $3.83 per pound on June 13, down $0.07 since May 9. However, it had closed as low as $3.56 per pound between those dates.
The price of aluminum has been trending lower in fits and starts since mid-April. It closed on June 13 at $2,234, down $86 from its close on May 9. It had traded as high as $2,442 in mid-April.
Price changes for several of the more finished goods from our sample are illustrated in the final chart, below.
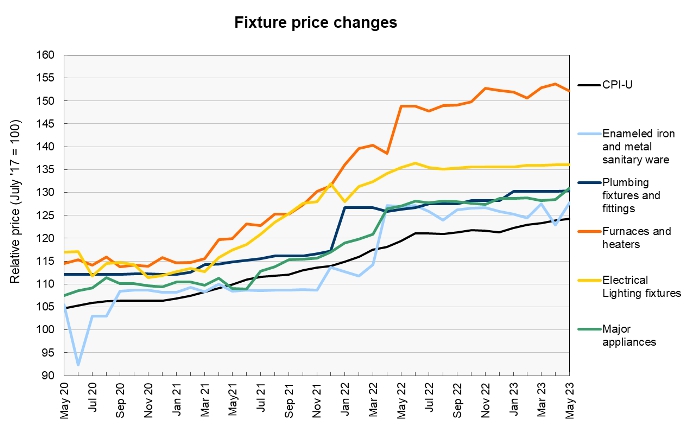
The price index for enameled iron and metal sanitary ware had the largest reported price jump this month. However, this is almost entirely due to April’s price index being revised lower. Its price index is nearly unchanged from its level in March.
The price index for major appliances also moved higher this month, rising 2.0 percent. However, this index is up only 3.1 percent year-over-year and its post -pandemic price rise is at the lower end of those of the construction materials prices that we track.
The full current BLS report can be found here.


