

The producer price index (PPI) report from the Bureau of Labor Statistics (BLS) stated that construction materials prices were unchanged month-over-month in June, seasonally adjusted. The index of components and materials for construction was also unchanged from its year-earlier level.
Overall prices for processed goods for intermediate demand fell by 0.6 percent in the month. The processed goods for intermediate demand index was 9.4 percent lower than its year-earlier level.
For reference, the changes in these indices compare with a 3.0 percent rise in the all-items consumer price index (CPI-U) for the 12 months ending in June. The seasonally adjusted June CPI-U was up 0.2 percent from May’s level. The shelter portion of the CPI-U was up 0.4 percent for the month and was 7.8 percent higher than its year-ago level.
Yield Pro compiled the BLS reported changes for our standard list of construction materials prices. These are prices of materials which directly impact the cost of constructing an apartment building. The two right hand columns of the table provide the percent change in the price of the commodity from a year earlier (12 Mo PC Change) and the percent change in price from May (1 Mo PC Change). If no price data is available for a given commodity, the change is listed as N/A.
The pre-COVID column lists the change in the current construction materials prices relative to the average of prices from December 2019 through February 2020, before the pandemic impacted the economy. This may give a truer idea of the magnitude of the recent price increases for materials, such as lumber, whose prices were already rising sharply last year, than does the 12 Mo PC Change column.
| Commodity | 12 Mo PC Change | 1 Mo PC Change | Pre-covid Change |
| Softwood lumber | (20.8) | (1.3) | 19.8 |
| Hardwood lumber | (15.6) | (1.1) | 27.3 |
| General millworks | 2.2 | (0.2) | 29.4 |
| Soft plywood products | (25.1) | (0.4) | 69.2 |
| Hot rolled steel bars, plates and structural shapes | (10.8) | (0.5) | 62.7 |
| Copper wire and cable | (7.3) | (3.3) | 26.6 |
| Power wire and cable | 18.5 | 1.1 | 102.3 |
| Builder’s hardware | 4.6 | 0.0 | 25.5 |
| Plumbing fixtures and fittings | 2.9 | 0.0 | 17.7 |
| Enameled iron and metal sanitary ware | 0.5 | 0.5 | 21.5 |
| Furnaces and heaters | 4.2 | 1.9 | 36.6 |
| Sheet metal products | 0.6 | 1.5 | 46.7 |
| Electrical Lighting fixtures | (0.3) | (0.0) | 18.1 |
| Nails | (9.6) | 0.0 | 39.5 |
| Major appliances | 2.5 | 0.2 | 23.5 |
| Flat glass | 11.0 | 3.3 | 37.9 |
| Ready mix concrete | 12.1 | 0.2 | 28.5 |
| Asphalt roofing and siding | 3.1 | 1.9 | 38.8 |
| Gypsum products | 2.5 | (0.3) | 42.2 |
| Mineral wool insulation | 5.0 | (0.4) | 41.7 |
The first chart, below, shows the price index history for wood products over the past 37 months. Note that the prices used by the BLS in compiling the indexes are collected on the Tuesday of the week containing the 13th day of the month. In June that would have been June 13. In the July report, the data collection date will be July 11.
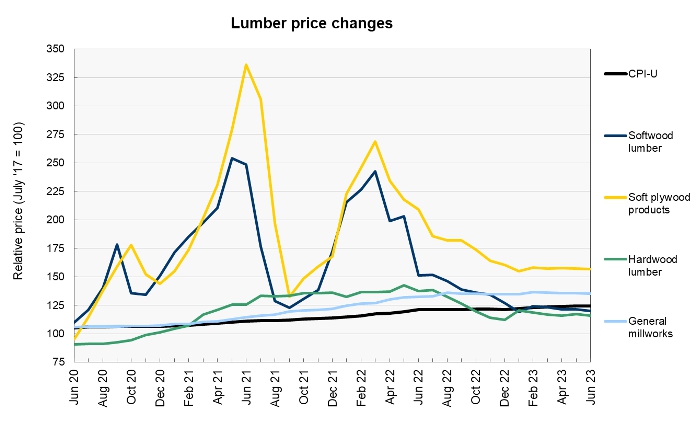
Wholesale lumber prices have been very stable for the last 6 months after two and one half years of extreme volatility. Prices for the four lumber categories that we track were lower in the latest report compared to last month. However, year over year comparisons for these construction materials prices are currently being made to the high prices of 12 months ago. These comparisons will be less favorable in the months ahead as they will be made to the falling prices of last summer.
Looking ahead, NASDAQ reported that the market price of lumber closed on June 13 at $528 and rose to $589 on July 11. The price rise between these dates was steady with only 3 days in the period with closing prices below that on June 13. However, lumber prices in the futures markets indicate that price rises may have run their course. The November 2023 contract closed on July 11 at $590, nearly the same as the current spot price.
The next chart, below, shows the recent history of several other construction materials prices. These are relatively simple commodities whose prices are strongly driven by those of the materials of which they are comprised.
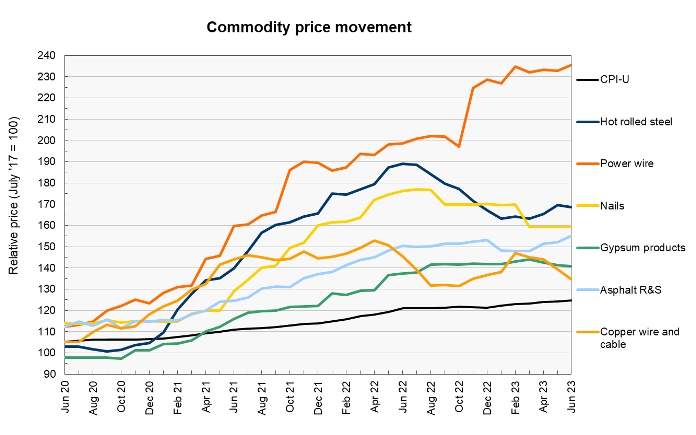
Power wire and cable once again had by far the largest post-pandemic rise of the construction materials prices we track. Much of its year-over-year price rise occurred during a price surge that happened late last year at a time when other construction materials prices were moderating. By contrast, the price index for copper wire and cable had the largest monthly fall in the current report.
Hot rolled steel bars and plates once again had the third highest post-pandemic increase of our construction materials prices. It also occupies the number 3 spot on our list for post-pandemic price increases. As described below, steel futures have been moving higher, indicating that more price increases may be in store.
Looking ahead at prices for underlying materials, MarketWatch reported that the NYSE American steel index generally moved higher leading up to the June report. It closed at $1,845 on June 13 but rose to $1,922 on July 11. Meanwhile, steel futures surged in mid-June only to fall through early July. The November 2023 contract closed at effectively the same price on July 11 as it had on June 13. However, it had risen as much as 6.5 percent between June 13 and June 18.
The price of copper closed at $3.77 per pound on July 11, down $0.06 since June 13. However, it had closed as high as $3.91 per pound between those dates.
The price of aluminum has been generally trending lower recently. It closed on July 11 at $2,167, down $77 from its close on June 13. However, it had traded as low as $2,129 in early July.
Price changes for several of the more finished goods from our sample are illustrated in the final chart, below.
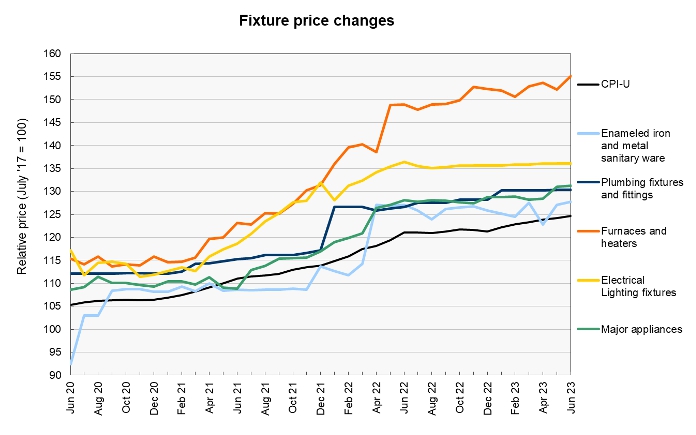
The month-over-month price rise for furnaces and heaters was the second largest of those of the construction materials prices we track, behind only that of flat glass. The price of enameled iron and metal sanitary ware, the price rise leader from last month, was reported to jump another 0.5 percent this month. However, that was only because last month’s reported price index was revised lower by 0.5 percent this month.
The full current BLS report can be found here.


