

CoreLogic reported that their single-family rent index (SFRI) for August rose 2.9 percent from its year-earlier level. This is down from the 3.1 percent year-over-year rent growth reported last month. The August report continues the string of declines in the rent growth rate since it reached a recent peak in April 2022.
Overall history
The history of the overall SFRI growth rate since January 2020 is shown in the first chart, below.
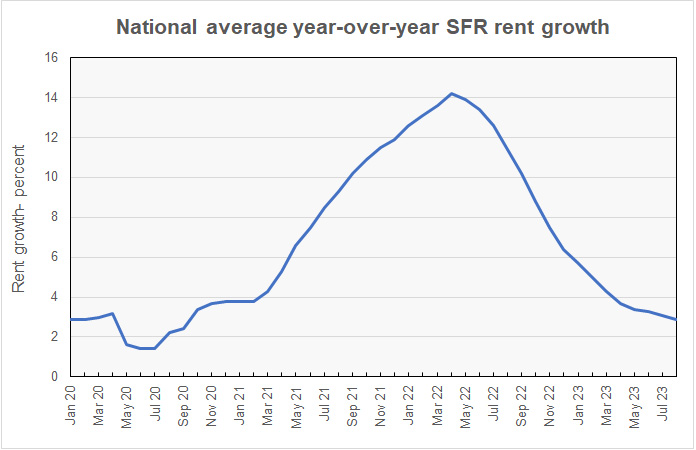
The chart shows that the rate of growth in single-family rents has been declining at a reduced rate in recent months. Year-over-year rent growth is now near its pre-pandemic level.
For comparison, Yardi Matrix found that single-family rent growth in August was 0.5 percent year-over-year. However, Yardi Matrix focuses on properties of 50 or more units while CoreLogic takes a broader look at the single-family rental market.
Price tiers grow at different rates
In addition to the overall SFRI, CoreLogic calculates SFR rent growth by the relative asking rent for the properties it covers. It divides the properties into 4 groups: those priced at 75 percent or less than the regional median (Low), those priced at 75 to 100 percent of regional median (Low-mid), those priced at 100 to 125 percent of regional median (High-mid) and those priced above 125 percent of regional median (High). The results for August 2023 are shown in the next chart, below.
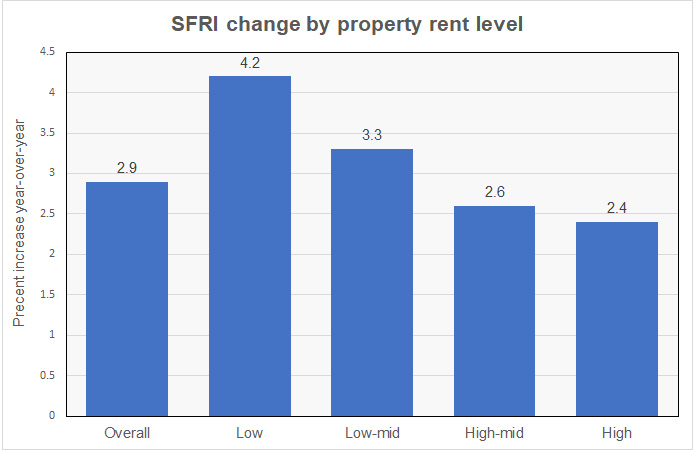
The chart shows that the average SFR rent growth is higher for properties in the lower rent tiers. It progressively declines for each higher price tier.
The last chart shows the relative rate of decline in SFR rent growth over the last 6 months by rent tier. Each cluster of bars shows the ratio of the rates of rent growth measured for that property rent tier for the last 6 months compared to its level 6 months ago.
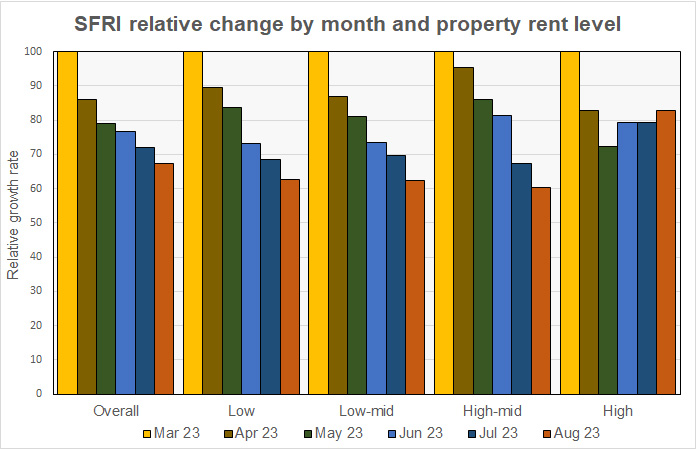
The chart shows that the highest relative rent decline over the last six months is for the high-mid properties at 40 percent, although the declines for the low-mid and low tiers are close at 38 percent and 37 percent respectively. The lowest relative rent decline is for high-priced properties at 17 percent.
Ranking the metros
CoreLogic reports the year-over-year rate of growth in the SFRI for a select group of metropolitan areas. In August, St. Louis remained in the top position it assumed last month. It recorded SFR rent growth of 7.0 percent, down from 7.2 percent last month. Chicago remained in second place, although its rent growth rate rose to 6.7 percent from 6.3 percent last month. Boston (5.6 percent), San Diego (5.6 percent) and New York (4.6 percent) round out the top 5 metros, just as they did last month.
Three of the metros listed saw SFR rents decline. They are Austin (-0.9 percent), Las Vegas (-0.8 percent) and Miami (-0.5 percent).
CoreLogic is a data and analytics company. It calculates the SFRI using “a repeat pairing methodology to single-family rental listing data in the Multiple Listing Service.” The CoreLogic report is available here.


