

The Bureau of Labor Statistics (BLS) released its producer price index report for July 2021. It showed that construction materials prices were up 0.6 percent in the month, seasonally adjusted. The index of materials and components for construction was also 20.4 percent higher than its year-earlier level.
Overall prices for processed goods for intermediate demand rose by 1.7 percent in the month. This index was 22.9 percent higher than its year-ago level.
For reference, the changes in these indices compare with a 5.4 percent rise in the all-items consumer price index (CPI-U) for the 12 months ending in July. The CPI-U was up 0.9 percent for the month. Over the last 3 months, the CPI-U has risen at an annualized rate of 9.6 percent.
The shelter portion of the CPI-U was up 0.4 percent in June. It was up 2.8 percent over the prior 12 months.
Yield Pro (PRO) compiled the BLS reported price changes for our standard list of construction commodities. These are commodities whose prices directly impact the cost of constructing an apartment building. The two right hand columns of the table provide the percent change in the price of the commodity from a year earlier (12 Mo PC Change) and the percent change in price from June 2021 (1 Mo PC Change). If no price data is available for a given commodity, the change is listed as N/A.
| Commodity | 12 Mo PC Change | 1 Mo PC Change |
| Softwood lumber | 45.2 | -21.3 |
| Hardwood lumber | 45.8 | 6.3 |
| General millworks | 9.3 | 1.5 |
| Soft plywood products | 169.8 | 3.0 |
| Hot rolled steel bars, plates and structural shapes | 43.7 | 6.0 |
| Copper wire and cable | 34.9 | -1.6 |
| Power wire and cable | 38.6 | 0.4 |
| Builder’s hardware | 10.0 | 0.3 |
| Plumbing fixtures and fittings | 3.1 | 0.3 |
| Enameled iron and metal sanitary ware | 5.6 | 0.0 |
| Furnaces and heaters | 8.5 | 0.6 |
| Sheet metal products | 23.2 | 1.7 |
| Electrical Lighting fixtures | 6.4 | 0.5 |
| Nails | 20.5 | 7.7 |
| Major appliances | 3.2 | 3.6 |
| Flat glass | 12.4 | 2.6 |
| Ready mix concrete | 2.8 | 0.0 |
| Asphalt roofing and siding | 10.9 | 1.3 |
| Gypsum products | 21.6 | 2.6 |
| Mineral wool insulation | 14.8 | -0.1 |
The first chart, below, shows the price index history for wood products over the past 25 months. Note that the prices used in compiling the indexes are collected on the Tuesday of the week containing the 13th day of the month. In July 2021 that would have been July 13. Because prices for some of the commodities that we are tracking are changing rapidly and because the prices tracked here are at the wholesale level, the changes in the indexes reported by the BLS may not reflect current retail pricing.
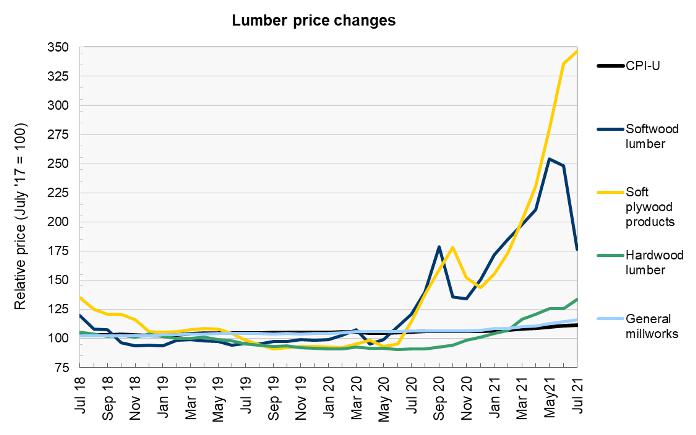
The wholesale market price of lumber is well off the high nearly $1,700 it reached in early May. After trading around $650 per contract in mid-July, the price has continued to fall to around $500 in mid-August. This is still significantly higher than its price in 2019 when it traded between $300 and $400 for most of the year. Lumber prices in the futures markets have also declined since last month. The January 2022 contract was trading around at $550 as of mid-August, down $100 over the last month. However, prices of futures contracts further out are in the $600 range, indicating that the futures markets expect lumber prices to remain elevated for some time.
The price of soft plywood products increased again this month, according to the BLS. The price increases seen for soft plywood products have now far outpaced those of any of the other construction materials we track.
The next chart, below, shows the recent history of several other construction materials prices. The prices for hot rolled steel products and nails rose sharply during the month. The prices of copper wire and power wire, which have seen significant increases over the past year, either fell of rose only marginally during the month.
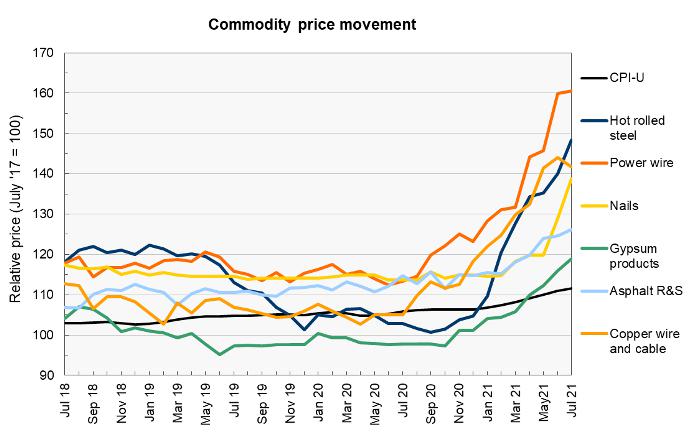
The price of steel has traded in a relatively narrow range since peaking on May 11 at $1,927. MarketWatch reports that it closed on August 11 at $1,920, down only slightly from the May high but up 76 percent from its level at the end of 2019. Steel futures continue to indicate that the price will decline only gradually over the next 12 months. The January 2022 contract is up $90 over the past month, trading around $1,565.
The price of copper occupied a narrow range for most of June and July before popping up in late July, closing at $4.54 per pound on July 27. However, by mid-August, it was near $4.35. Copper futures prices have stayed in line with the spot price, with the January 2022 contract trading at $4.35 per pound.
The price of aluminum has been trending higher by fits and starts. It reached a new closing high of nearly $2,616 on August 2. It is only slightly down from that high, closing at $2,575 on August 11.
Most of the other construction materials prices tracked in this chart have been rising for the last 6 months at increasing rates, with gypsum products and asphalt roofing and siding posting double-digit gains year-over-year.
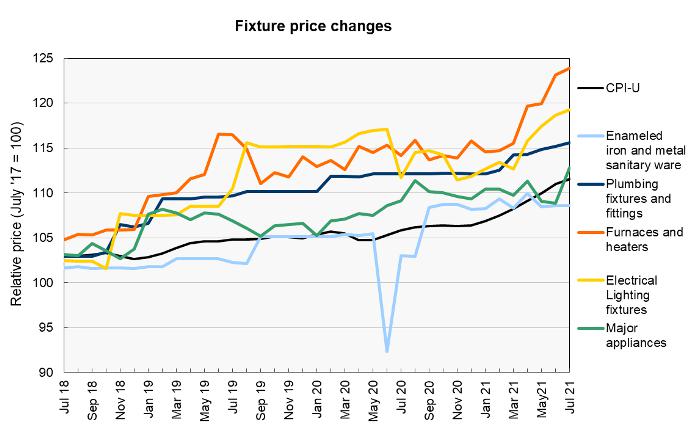
Price changes for several of the more finished goods from our sample are illustrated in the final chart, below. Over the past few months, Prices of furnaces and heaters and of electrical lighting fixtures have risen the fastest of the commodities shown. Prices for major appliances bear watching as they ticked up this month after falling last month.
The full BLS report can be found here.


