The Census Bureau released its quarterly report on home ownership and occupancy for Q1 2022. It showed that the rental housing vacancy rate was 5.8 percent, up from a level of 5.6 percent in Q4 2021. In Q1 2020, before the effects of the pandemic were widespread, the rental vacancy rate was 6.6 percent.
Different views of vacancies
The headline vacancy rate reported by Census, 5.8 percent in Q1, is for all rental housing in the country, both single-family and multifamily. Census breaks down this figure in various ways, including by the number of units in the building. The chart, below, illustrates this comparison.
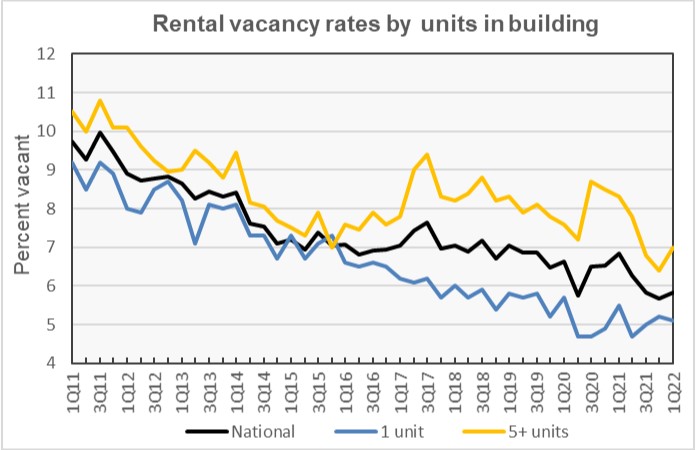
The chart shows that single family rentals have consistently had lower vacancy rates than have multifamily rentals and that the difference between the rates widened after 2016. It also shows that the rise in the vacancy rate for multifamily rentals in the latest quarter has not been matched with a corresponding rise in the vacancy rate of single-family rentals.
By the numbers, the single-family vacancy rate was 5.1 percent in Q1 2022, down from 5.2 percent in Q4 2021. The Census Bureau does not consider a rate change of this size to be statistically significant. The vacancy rate for units in buildings with 5 or more units was 7.0 percent in Q1 2022, up from 6.4 percent in Q4 2021.
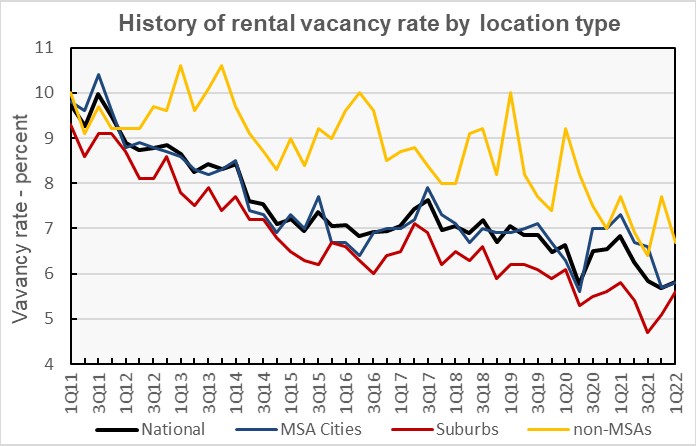
The overall rental vacancy rate in the core cities of the Census Bureau’s Metropolitan Statistical Areas (MSAs) was 5.8 percent in Q1 2022. This was marginally higher than the rate of 5.7 percent reported in Q4 2021. The rental vacancy rate in the suburbs of the MSAs was 5.6 percent in Q1 2022. This was up from the 5.1 percent rate reported in Q4 2021. These trends are shown in the next chart, below.
Tracking rentership
The Census Bureau reported that 34.6 percent of the country’s 127,574,000 occupied housing units were inhabited by renter households in Q1 2022. This rate is effectively the same as that in Q4 2021. The history of the number of occupied housing units and the share of renter households since 2011 is shown in the next chart, below.
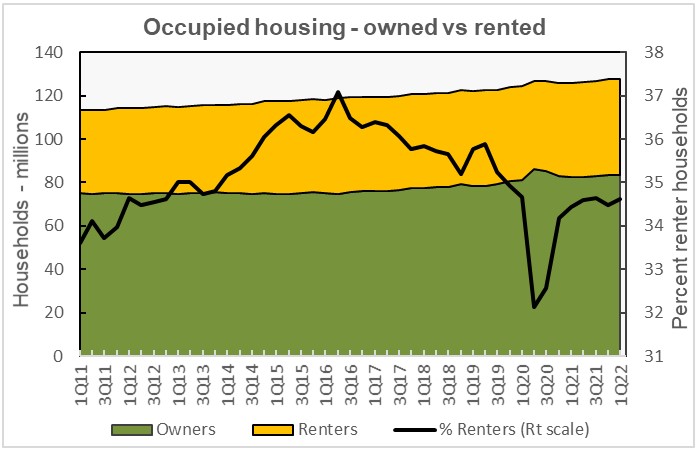
The chart shows that renters have occupied a decreasing portion of housing units since 2016 but that the portion of renter households has returned to nearly the level it was at before the drop that occurred soon after the pandemic-related lockdowns were imposed.
While the share of housing unit occupied by renters has fallen since 2016, the number of renter-occupied housing units has remained relatively steady, excluding the first year of the pandemic. Since Q2 2016, the number of renter-occupied housing units reported by the Census Bureau has been between 43.1 million and 44.2 million. Over the same period, the number of owner-occupied housing units has risen from 74.7 million in Q2 2016 to 83.4 million in Q1 2022.
Rent reporting
The Census Bureau also tracks the median asking rents for the country as-a-whole. The history of their findings is shown in the next chart, below. Census reported that rents have moved higher after declining at the end of last year, with the national average rent coming in at $1,255 in Q1 2022.
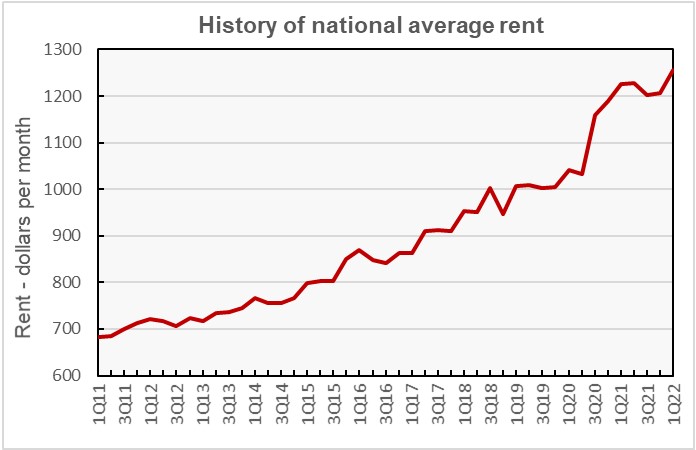
The report from Census is different than the results reported elsewhere which indicate that rents rose throughout last year. However, those reports focused on large, professionally managed multifamily properties while the Census report attempts to cover all rental housing in the United States.
The Census report is called Quarterly Residential Vacancies and Homeownership, First Quarter 2022. It is available here.


