The “Week 44” edition of the Census Bureau’s Pulse Survey has been released. It shows that the portion of renters who are behind on their rent payments dropped slightly since we last reported on this survey and is now at the lowest level since the survey began almost 2 years ago.
What is the Pulse Survey?
The Pulse Survey is an experimental program that the Census Bureau started shortly after economic shutdowns were imposed in response to COVID-19. It was designed to assess how the population of the country was faring under the economic stress caused by the reaction to the pandemic. The current survey, designated Week 44, posed questions which are part of what Census calls Phase 3.4 of the survey.
The Week 44 survey collected data from March 30 to April 11. This is 4 weeks after the period in which the “Week 43” survey data was collected and 9 weeks after the last survey we reported on. The renter portion of the survey covers renters of both multifamily and of single-family properties.
Tracking delinquencies
Renters in all phases of the survey have been asked whether they are behind on their rent. While some say that they occupy their housing without paying rent and some did not report whether they are current on their payments, the majority of respondents answered the question Yes or No. The portion of respondents who pay rent saying that they are not current has varied from survey to survey. The first chart, below, shows the history of responses to this question. Note that the “Week 44” survey was taken 98 weeks after the initial Pulse Survey.
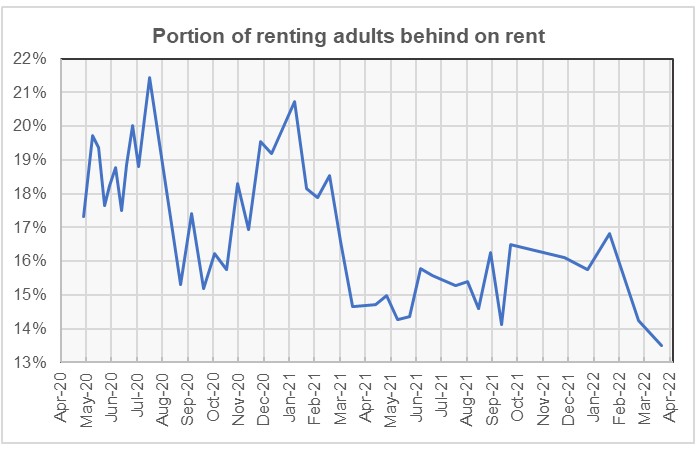
The chart shows that the portion of renters who are behind on their rent has remained relatively stable recently compared to the early days of the pandemic. The two most recent surveys have resulted in the portion of respondents saying that they are behind on their rent falling to the lowest levels seen in the survey. However, the response to this question varies from survey to survey so this result may not be repeated next month.
Seeking help
A new question introduced in Phase 3.3 asked whether the respondent had sought government assistance in paying their rent. A comparison of the responses in the “Week 42” survey and those in the “Week 44” survey taken 9 weeks later is illustrated in the next chart, below.
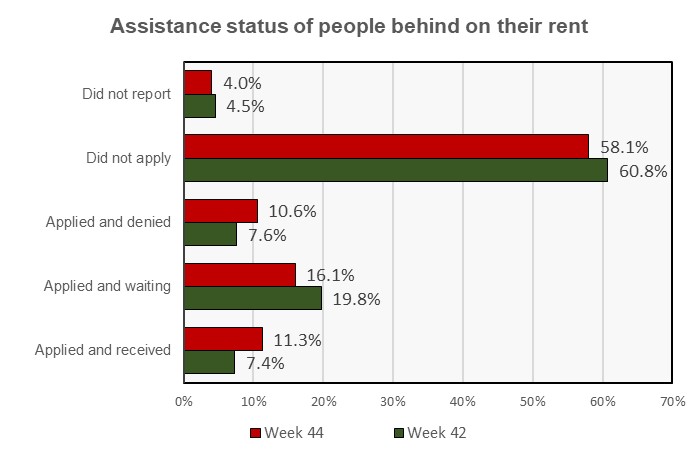
The chart shows the sorts of trends that one would expect. Over time, more of the people who are behind on their rent would be expected to apply for assistance. This is reflected in the declining portion of respondents who said that they have not applied. The chart also shows that a greater portion of the respondents have either received assistance or been told that they have been denied and that fewer respondents are waiting to hear one way or the other. However, all of these changes have been relatively small in size, indicating that the process of obtaining assistance is a slow one.
The “Week 44” Pulse survey identified 3,111,978 people who said that they had received assistance. This is up from 2,877,902 who had received rental assistance according to the “Week 42” survey. Given that money is available in the two rental assistance funds passed by Congress last year, it is a little surprising that more people have not received assistance.
Profiling the participants
The Pulse Survey asked a series of questions to determine the characteristics of the different households responding to the survey. One question was how many people are in the household. The responses are shown in the first chart, below. The bars show the percentage of respondents within a particular category (current or not current on rent) who responded a certain way.
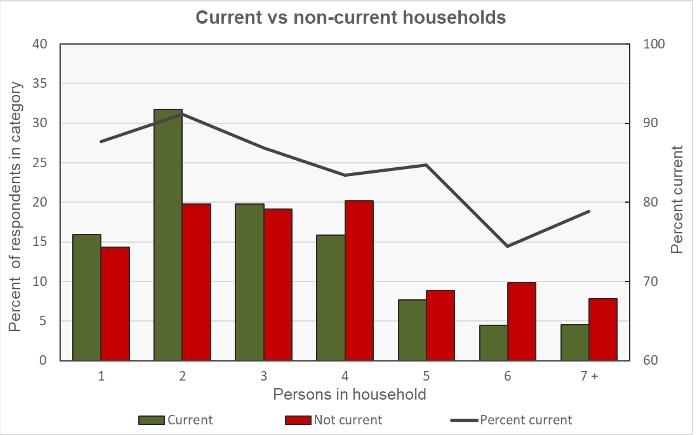
This chart is a little busy so here is an example of how to read the data for a two-person household: the bars on the chart show that about 32 percent of adults who were current on their rent resided in two-person households. About 20 percent of adults who were not current on their rent resided in two-person households. In either case, the two-person household could consist of one adult and one child or it could consist of two adults; the survey does not differentiate between them. The right-hand scale and the black line indicate that about 91 percent of adults residing in two-person households were current on their rent.
Of the respondents who reported being current on their rent, 33 percent said that they had children in the household. Of those reporting being behind on their rent, 51 percent reported having children in the household.
Of the respondents who reported being current on their rent, 85 percent said that they or a household member had experienced no loss of employment income over the prior 4 weeks. Of those reporting being behind on their rent, 37 percent reported that they or a household member had experienced a loss of employment income.
The next chart shows the current/not current status of the respondents by household income level. As in the above chart, the bars show the percentage of adults within a particular category (current or not current on the rent) who reported having a certain household income level. Not surprisingly, a much higher percentage of adult respondents who were behind on their rent reported having lower incomes.
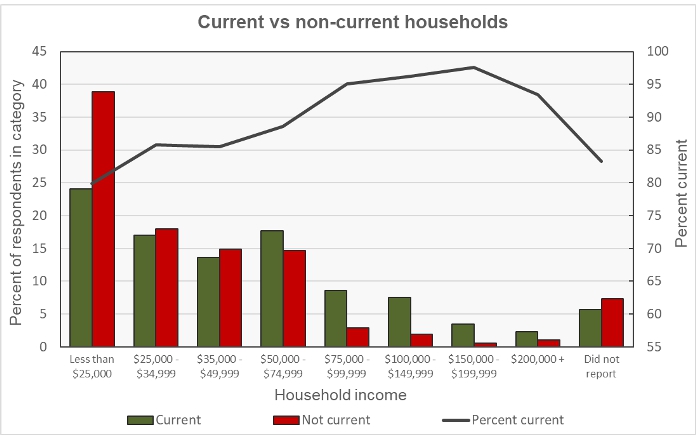
An example of reading this chart for the “Less than $25,000” category is that about 24 percent of responding adults who were current on their rent reported living in households with incomes of less than $25,000. About 39 percent of adults who were behind on their rent reported living in households whose income was less than $25,000. The black line is read on the right-hand scale. It indicates that about 80 percent of adults living in households earning less than $25,000 reported that they were current on their rent.
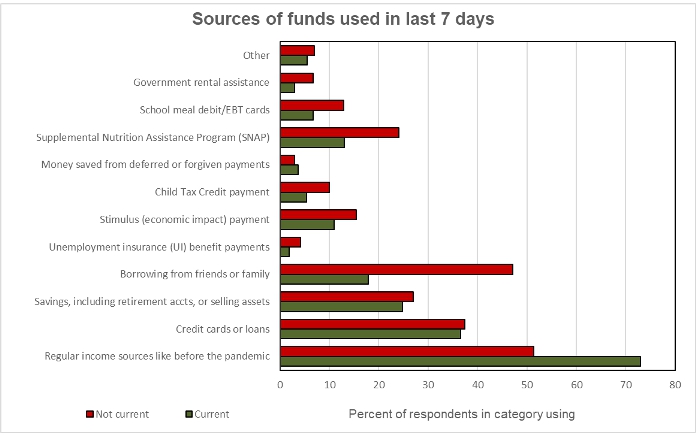
The final chart shows the sources of the funds survey respondents used to meet spending needs. Many of the differences between the people who are current on their rent and those who are behind are as one would expect: the former are more likely to rely on regular sources of income while the latter are more likely to rely on borrowing and on government assistance.