Yardi Matrix reported that national average apartment rent growth turned positive in October with rents increasing $3 from September’s revised level to $1,727 per month.
YoY rent growth rate slide continues
The national average asking apartment rent was up 8.2 percent in October from its year-earlier level. This rate of increase was down 1.2 percentage points from that reported last month. This was the eighth month in succession with a declining rate of year-over-year growth in asking rents.
Transacted rent growth for leases that were renewed was 10.9 percent in September. The national average lease renewal rate was 60.2 percent.
Rents in the “lifestyle” asset class, usually Class A properties, rose 7.0 percent year-over-year, while rents in “renter by necessity” (RBN) properties increased by 9.7 percent year-over-year. The chart, below, shows the history of the year-over-year rent growth rates for these two asset classes along with the difference between these rates.
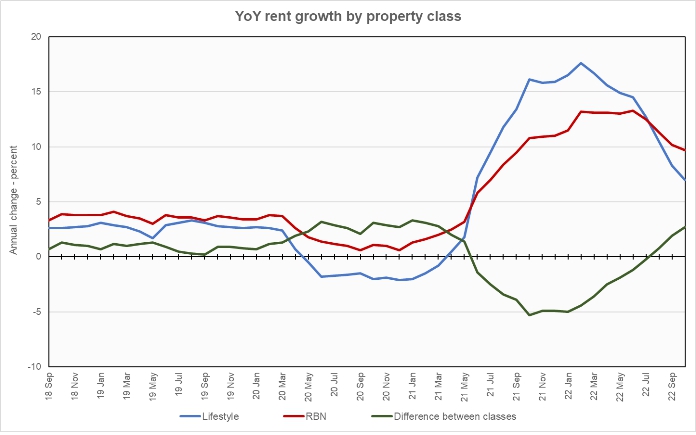
The chart shows that year-over-year growth in asking rents for both classes of property are declining but remain well above their pre-pandemic levels. The more rapid decline in the rate of rent increases for lifestyle properties has caused the difference in their growth rates to grow to well above the pre-pandemic norm, if not yet to the highs it reached in the first year of the pandemic.
Yardi Matrix also reported that single-family rental (SFR) rents were unchanged from the revised level of the month before at $2,088 per month. The year-over-year rent growth rate fell to 6.6 percent. The national occupancy rate for single-family rentals was strong at 96.1 percent in September. However, this was down 1.3 percentage points from its level one year ago.
Tracking other metrics
Yardi Matrix now reports on other key rental market metrics in addition to rent growth. These include the average rent to income ratio, the rent growth rate for residents who renew their leases and the portion of residents who do renew. The metro averages are included in the tables below, but the report also includes the rent to income ratios for both lifestyle and for RBN properties.
Of the top 30 metros by population, the ones with the largest annual apartment rent increases as ranked by Yardi Matrix are given in the table, below, along with their annual percentage rent changes, overall rent to income ratio, rent growth for renewed leases and renewal rate for the month. The data on asking rent growth is for October. The other data is for September.
| Metro | YoY asking rent growth % | Rent to income ratio % | YoY renewal rent growth % | Monthly lease renewal rate % |
| Indianapolis | 11.8 | 25.2 | 9.5 | 61.9 |
| Orlando | 11.6 | 32.1 | 15.9 | 62.5 |
| Miami Metro | 11.4 | 27.8 | 20.4 | 63.6 |
| San Jose | 10.6 | 27.5 | 5.1 | 43.9 |
| Dallas | 10.5 | 28.0 | 14.2 | 58.3 |
| Kansas City | 9.8 | 24.9 | 10.7 | 67.9 |
| Nashville | 9.7 | 31.1 | 15.7 | 53.6 |
| Charlotte | 9.4 | 28.2 | 14.9 | 57.1 |
| Raleigh | 9.3 | 27.7 | 18.8 | 62.9 |
| Boston | 9.0 | 28.9 | 11.2 | 60.4 |
The major metros with the smallest year-over-year apartment rent growth as determined by Yardi Matrix are listed in the next table, below, along with the other data as in the table above.
| Metro | YoY asking rent growth % | Rent to income ratio % | YoY renewal rent growth % | Monthly lease renewal rate % |
| Twin Cities | 3.3 | 28.8 | 7.2 | 56.9 |
| Las Vegas | 3.9 | 29.6 | 15.0 | 61.0 |
| Phoenix | 4.1 | 29.0 | 15.0 | 60.4 |
| Sacramento | 4.4 | 32.2 | 10.1 | 55.0 |
| Baltimore | 4.7 | 32.2 | 9.8 | 66.9 |
| San Francisco | 5.2 | 34.2 | 3.7 | 43.1 |
| Atlanta | 5.8 | 28.8 | 12.0 | 61.3 |
| Houston | 6.2 | 27.0 | 6.0 | 59.0 |
| Washington DC | 6.2 | 34.6 | 7.4 | 53.9 |
| Denver | 6.5 | 29.4 | 10.2 | 55.4 |
The top metros for month-over month rent growth in October were New York, Indianapolis and Kansas City. The metros with the lowest month-over-month rent growth were Las Vegas, Seattle and Phoenix. Of the 30 major metros tracked by Yardi Matrix, half saw negative month-over-month rent growth in October.
The business of apartments
The discussion section of this month’s report talks about where investors might allocate their capital in an environment of high interest rates and economic uncertainty. It suggests lending to property owners as an option. Mortgage loans in the senior part of the capital stack currently have coupons in the 6 percent range while loans providing gap capital are fetching rates of 12 to 15 percent.
SFR market also softens
Yardi Matrix also reported on the top 34 metros for single family rentals. This month, 31 of the 34 metros covered saw positive year-over-year rent growth, with Atlanta, San Francisco and Detroit being the exceptions. The leading metros for year-over-year rent growth were Washington D.C., Sacramento and Tampa.
This month, 27 of the metros saw year-over-year declines in occupancy, up 1 from last month. The leading metros for year-over-year SFR occupancy growth were Philadelphia, Pittsburgh and Cleveland. Las Vegas, Seattle and Miami saw the greatest SFR occupancy declines.
The complete Yardi Matrix report provides information on some of the smaller multifamily housing markets. It also has more information about the larger multifamily markets including numbers on job growth and completions of new units. It includes charts showing the history of rent changes in 18 of the top 30 markets over the last 4 years. It can be found here.