

A report from the Mortgage Bankers’ Association (MBA) says that originations of multifamily mortgages in Q2 2023 were up 37 percent quarter-over-quarter but were down 48 percent year-over-year. Originations of all commercial mortgages as a single asset class fell 53 percent year-over-year.
Commercial mortgage originations down for the year
The first chart, below, shows the MBA’s quarterly origination volume indexes since Q1 2018 for both all commercial mortgages as a single asset class and for multifamily mortgages. The indexes are reported relative to the year 2001, with the average quarterly volume in that year defined as a value of 100.
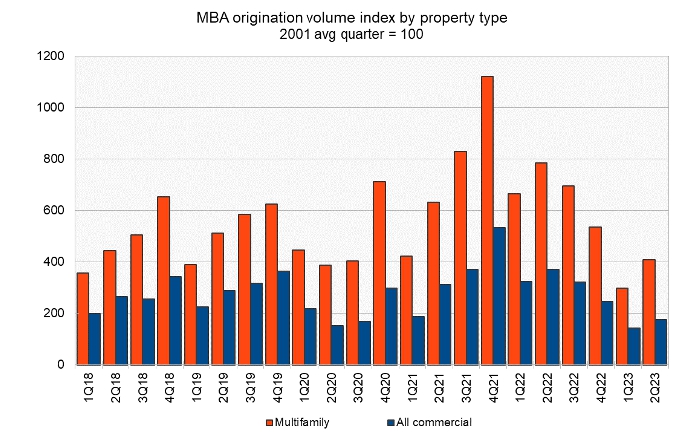
So far, 2023 is conforming to the usual pattern of mortgage origination volume declining in Q1 from the level in Q4 of the previous year, and then volume building from Q1 to Q2. However, in most years, the mortgage origination volume in each quarter is higher than that in the same quarter in the previous year. In the each of the first two quarters of 2023, mortgage origination volume is only about half of that of the same quarter in previous year. This was also true for Q4 2022. However, the multifamily mortgage origination quarter-over-quarter volume jump in Q2 was the highest percentage quarterly increase seen in any Q2 going back to 2015 except for that of Q2 2021.
All six property categories mentioned in the report (multifamily, office, retail, industrial, hotel and health care), saw mortgage origination volumes decline in Q2 2023 on a year-over-year basis. However, only retail and hotel saw volumes decline quarter-over-quarter, with drops of 13 percent and 27 percent respectively.
Tracking lenders
The MBA report also includes data on the sources of the commercial mortgages being originated. However, this section of the report does not break out multifamily lending from lending for other types of commercial real estate.
The report provides data on five categories of lenders: commercial mortgage-backed securities (CMBS) and conduits, depositories (aka commercial banks and savings and loans), life insurance companies, the government sponsored entities (GSEs), Fannie Mae and Freddie Mac, and investor-driven lenders such as REITs and specialty finance companies. The index values are quoted relative to the average quarterly origination volumes in the year 2001. The index values of different originators cannot be used to compare their absolute levels of mortgage originations since their origination levels in the baseline year of 2001 were different.
To gain insight into the absolute levels of funding provided by the different classes of originators, readers should look to the MBA’s report on mortgage debt outstanding. However, the origination index values can be compared to see which classes of originators are growing their business and which are not.
The final chart shows the history of commercial mortgage origination volume indexes since Q1 2018 by class of lender. It shows that commercial mortgage originations rebounding in Q2 for three of the five classes of lenders.
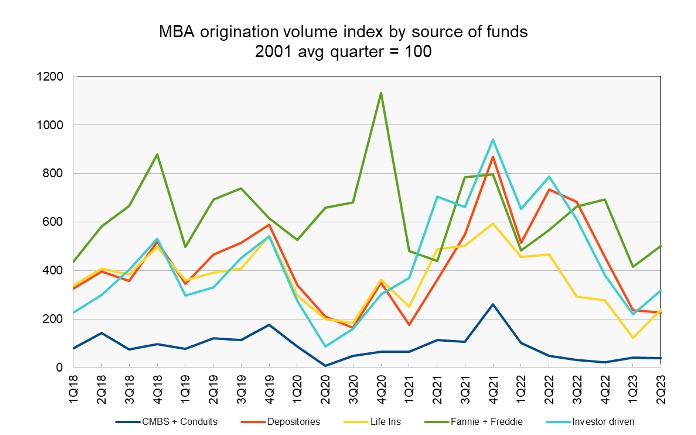
Compared to Q1, life insurers saw the largest relative increase in originations with a rise of 95 percent in Q2. Investor-driven lenders saw the next largest relative increase with a rise in originations of 46 percent. Originations rose 22 percent for the GSE’s. Originations fell 4 percent quarter-over-quarter for depositories and 7 percent for CMBS and conduits.
All five classes of lenders saw their commercial mortgage originations fall year-over-year. Issuance fell 22 percent for CMBS, , 69 percent for depositaries, 49 percent for life insurers, 11 percent for GSEs and 60 percent for investor-driven lenders.
The full report from the MBA includes additional information on lending for other commercial property types. It can be found here.


