

The Census Bureau released its quarterly report on home ownership and occupancy for Q2. It stated that the national rental housing vacancy rate was 6.3 percent, down from a level of 6.4 percent in Q1 2023 but up from a reported level of 5.6 percent in Q2 2022.
Vacancies through different lenses
The headline vacancy rate reported by Census is for all rental housing in the country, both single-family and multifamily. Census breaks down this figure in various ways, including by the number of units in the building. The chart, below, illustrates this comparison.
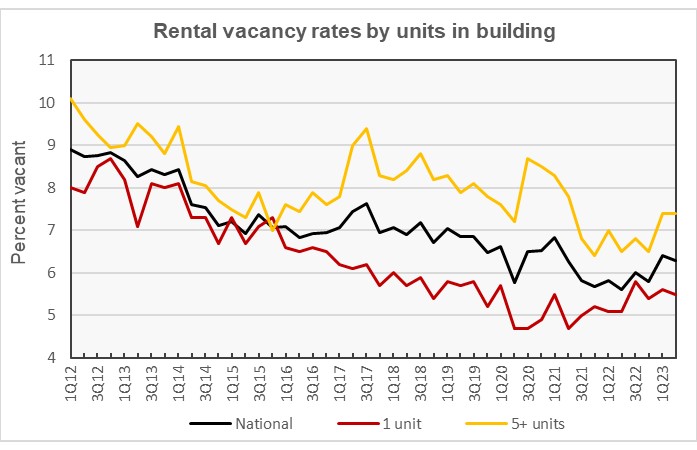
The chart shows that the Census Bureau found that the vacancy rate for multifamily housing with 5 or more units per building was unchanged in Q2 at 7.4 percent. However, the single-family vacancy rate ticked down 0.1 percentage point in the quarter to a level of 5.5 percent.
Note that other data sources, such as Apartment List, have reported that multifamily vacancy rates have been rising since reaching a recent low in Q3 2021. Vacancies at the end of Q2 as reported by Apartment list were 7.2 percent, near the Census Bureau estimate.
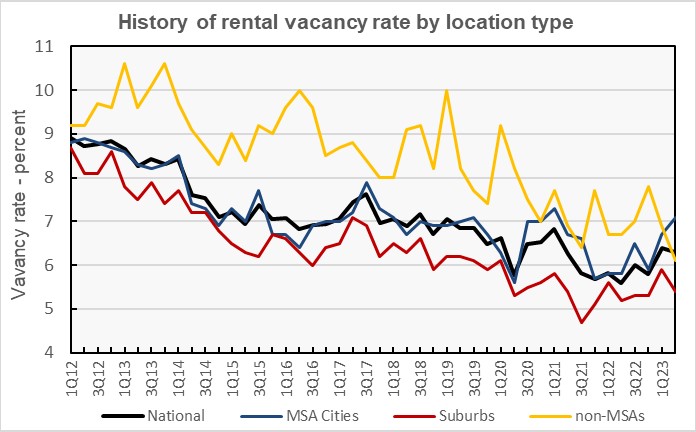
The rental vacancy rate in the core cities of the Census Bureau’s Metropolitan Statistical Areas (MSAs) was 7.1 percent in Q2 2023, up from 6.7 reported for the previous quarter. The rental vacancy rate in the suburbs of the MSAs was 5.4 percent in Q2 2023, down 0.5 percentage points from its level in Q1. These trends are shown in the next chart, below.
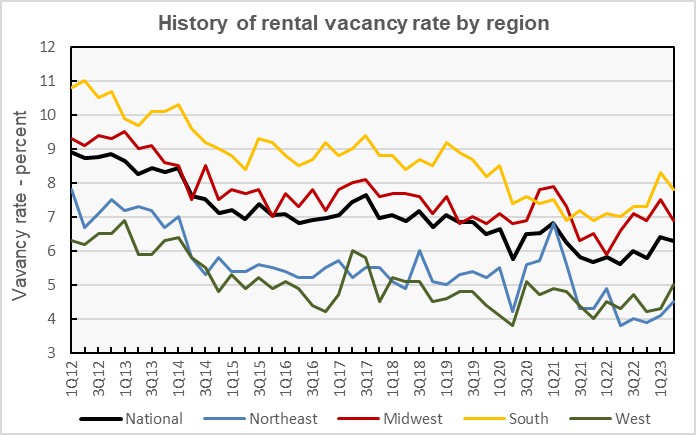
The rental vacancy rate history for each of the four Census regions is shown in the next chart, below. Vacancy rates were reported to fall in the Midwest and the South to 6.9 percent and 7.8 percent respectively. These are the regions that have had the higher vacancy rates. However, vacancy rates were reported to rise in the Northeast and the West to 4.5 percent and 5.0 percent respectively. These are the regions with the lower vacancy rates.
Census reported that 62 percent of vacant rental units were in structures with 2 or more units. Only about 14 percent of the vacant multifamily units had 3 or more bedrooms, with 1 bedroom units comprising 44 percent and 2 bedroom units comprising 39 percent of vacant stock. The median unit vacancy duration for multifamily properties in Q2 2023 was 2.6 months, up from 2.4 months one year earlier.
Tracking rentership rate
The Census Bureau reported that 34.1 percent of the country’s 130,100,000 occupied housing units were inhabited by renter households in Q2 2023. This rate is up slightly from that in Q1 as the number of homeowning households and the number of renter households both increased during the quarter.
The history of the number of occupied housing units and the share of renter households since 2012 is shown in the next chart, below. The chart shows that the reported number of renter households has been stuck in the range of 41 to 44 million since 2014, although the reading for Q2 2023 is at an all-time high of 44,320,000 households. However, since 2014, the reported number of homeowning households has increased by 10 million to a level of 85.8 million.
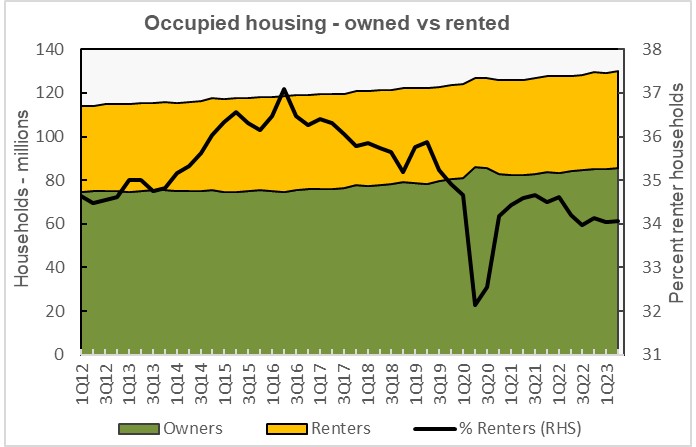
The number of renter-occupied housing units were reported to rise by 326,000 in Q2. The number of owner-occupied housing units was reported to rise by 541,000.
Rents are off their recent highs
The Census Bureau also tracks the median asking rents for the country as-a-whole. The history of their findings is shown in the next chart, below. Census reported that rents fell $17 per month in Q2 2023 to a national average of $1,445.
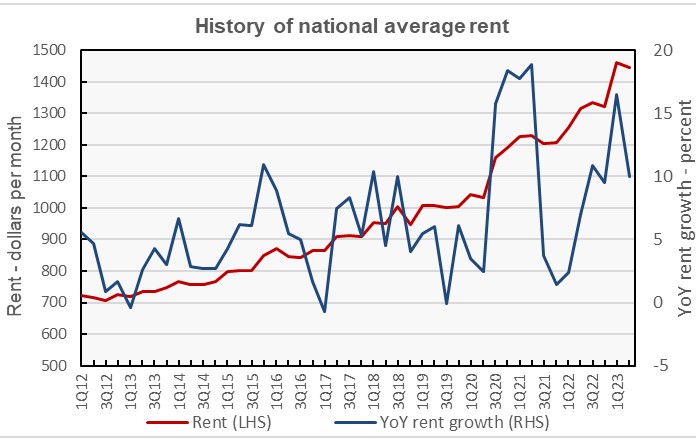
By contrast, Yardi Matrix reported that the national average apartment rent in June was $1,726 per month. However, Yardi Matrix tends to collect its data from larger, professionally managed properties while the Census Bureau attempts to collect data on all rental housing in the United States.
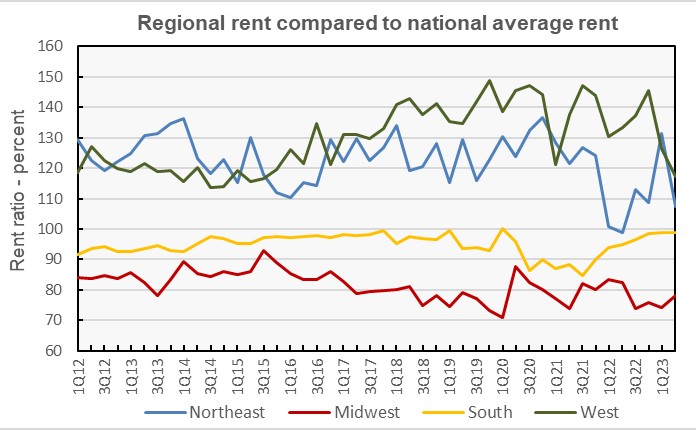
The last chart, below, shows the history of the average rent by Census region as a percentage of the national average rent. Rents in the Northeast as reported by the Census Bureau declined sharply in Q2 after leaping higher in Q1. Reported rents in the West also fell in Q2, declining 8 percent. Rents in the South fell 1 percent, matching the decline in the national average rent. The Midwest region was the only region where rents rose in Q2, with a gain of 4 percent.
The Census report is called Quarterly Residential Vacancies and Homeownership, Second Quarter 2023. It is available here.


