

The Census Bureau’s new residential construction report for March showed multifamily permits were flat for the month, and that was the relative bright spot. Both multifamily unit starts and completions were sharply lower.
The report on single-family housing construction showed that, on a seasonally adjusted basis, single family permits fell 5.7 percent month-over-month and 17.4 percent year-over-year to 1,021,000 units. After jumping last month, starts fell 12.4 percent month-over-month but were still up 21.2 percent year-over-year at 1,022,000 units. Completions also fell, dropping 10.5 percent month-over-month and 8.5 percent year-over-year to 947,000 units. The reported number of single-family units under construction rose 2,000 from the revised level of the month before to 689,000 units.
Multifamily housing permits flat
The number of permits issued for buildings with 5 or more units in March was reported to be 433,000 units on a seasonally adjusted, annualized basis. Permit issuance was unchanged from February’s revised (+4,000 units) figure. March permits were down 21.6 percent from the level recorded in March 2023 and were also down 9.5 percent from the trailing 12-month average.
In addition, 52,000 permits were issued in March for units in buildings with 2 to 4 units. This was down 6,000 units from the unchanged figure for February. March permits for units in buildings with 2 to 4 units were down 3.7 percent from the year-ago level but were up 0.3 percent from the trailing 12-month average.
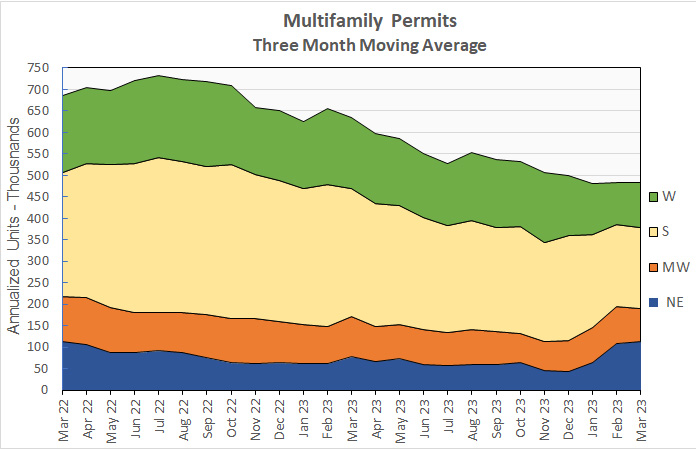
Regional data for multifamily housing is only reported for structures with two or more units. “Structures with 5 or more units” is not broken out as a separate category. Since the regional data is highly volatile and is frequently revised, it is examined here based on three-month weighted moving averages. This averaging helps smooth out the month-to-month variations in the data so that underlying trends are more visible.
Nationally, the three-month weighted moving average for permits issued for multifamily housing in March was up 0.1 percent from the level in February but was down 23.6 percent from the level of March 2023. The three-month weighted moving average for permits came in at 484,000 annualized units.
On a month-over-month basis, the three-month weighted moving average for multifamily permit issuance was up 8.9 percent in the West and 5.2 percent in the Northeast. Permit issuance fell 2.3 percent in the South and 11.0 percent in the Midwest.
When compared to year-earlier levels, the three-month weighted moving average of permits issued was up 48.1 percent in the Northeast but down in other regions of the country. Permits fell 18.1 percent in the Midwest, 35.2 percent in the West and 37.4 percent in the South.
The following chart shows the three-month weighted moving averages of permits by region for the last 25 months.
Multifamily housing construction starts plumet
The preliminary March figure for multifamily housing starts in buildings with 5 or more units was 290,000 units on a seasonally adjusted, annualized basis. This was reported to be down 76,000 units from the revised (-11,000 units) figure for February.
Compared to the year-earlier level, multifamily housing starts in buildings with 5 or more units were down 43.7 percent. The reported starts figure was 32.6 percent lower than the trailing 12-month average.
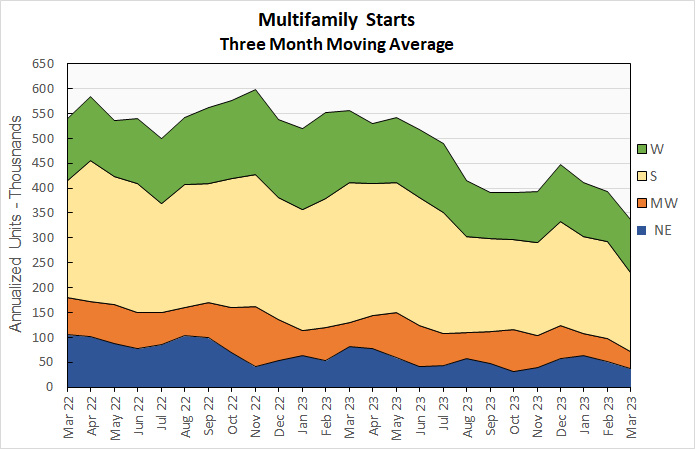
Multifamily housing construction starts (two or more units per building) in March were down 14.6 percent from their February level for the country as-a-whole, based on three-month weighted moving averages. Starts rose 5.4 percent in the West. Starts fell 18.7 percent in the South, 26.2 percent in the Midwest and 27.9 percent in the Northeast.
The three-month weighted moving average of starts was down 39.4 percent for the country-as-a-whole on a year-over-year basis. Compared to March 2023, starts were down 25.6 percent in the West, 27.2 percent in the Midwest, 43.9 percent in the South and 55.4 percent in the Northeast.
The following chart shows the three-month weighted moving average of starts by region for the last 25 months.
Multifamily housing completions crater
The preliminary March multifamily housing unit completions figure in buildings with 5 or more units per building was 502,000 units on a seasonally adjusted, annualized basis. After surging by 111,000 units last month, completions were reported to be fall by 125,000 units (19.9 percent) in March. In addition, February’s completions figure was revised lower by 14,000 units.
Compared to the year-earlier level, multifamily housing completions in buildings with 5 or more units per building were up 4.6 percent. Compared to the trailing 12-month average, completions were up 6.9 percent.
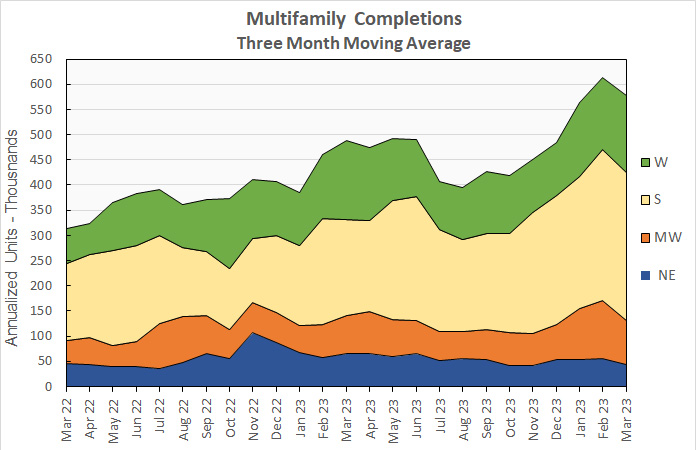
For the country as-a-whole, multifamily housing construction completions (two or more units per building) were down 5.8 percent month-over-month, comparing three-month weighted moving averages. The three-month weighted moving average of completions was up 6.7 percent in the West but down 2.1 percent in the South, 21.7 percent in the Northeast and 23.2 percent in the Midwest.
On a year-over-year basis, the three-month weighted moving average of completions in buildings with 2 or more units per building was up 18.2 percent nationally. Completions were up 53.4 percent in the South and 15.6 percent in the Midwest. Completions fell 2.7 percent in the West and 31.9 percent in the Northeast.
The three-month weighted moving average of completions by region for the past 25 months are shown in the chart below.
The number of multifamily units reported to be under construction fell again in March, continuing its series of declines since its recent high in July 2023. Census stated that there were 940,000 units under construction in buildings with 5 or more units per building on a seasonally adjusted annualized basis. This was reported to be down by 17,000 units from the revised (-9,000 units) level of the month before. It is 1.6 percent, or 15,000 units, lower than the number of units under construction one year earlier.
All data quoted are based on seasonally adjusted results and are subject to revision.


