Tag: Infographic
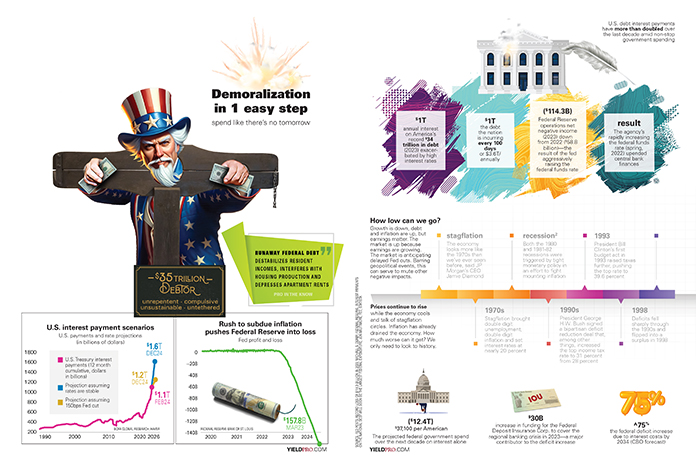
INFOGRAPHIC: Demoralization in 1 easy step
spend like there’s no tomorrow
Runaway federal debt destabilizes resident incomes, interferes with housing production and depresses apartment rents (PRO IN THE KNOW)
$35 trillion debtor
Unrepentant,...
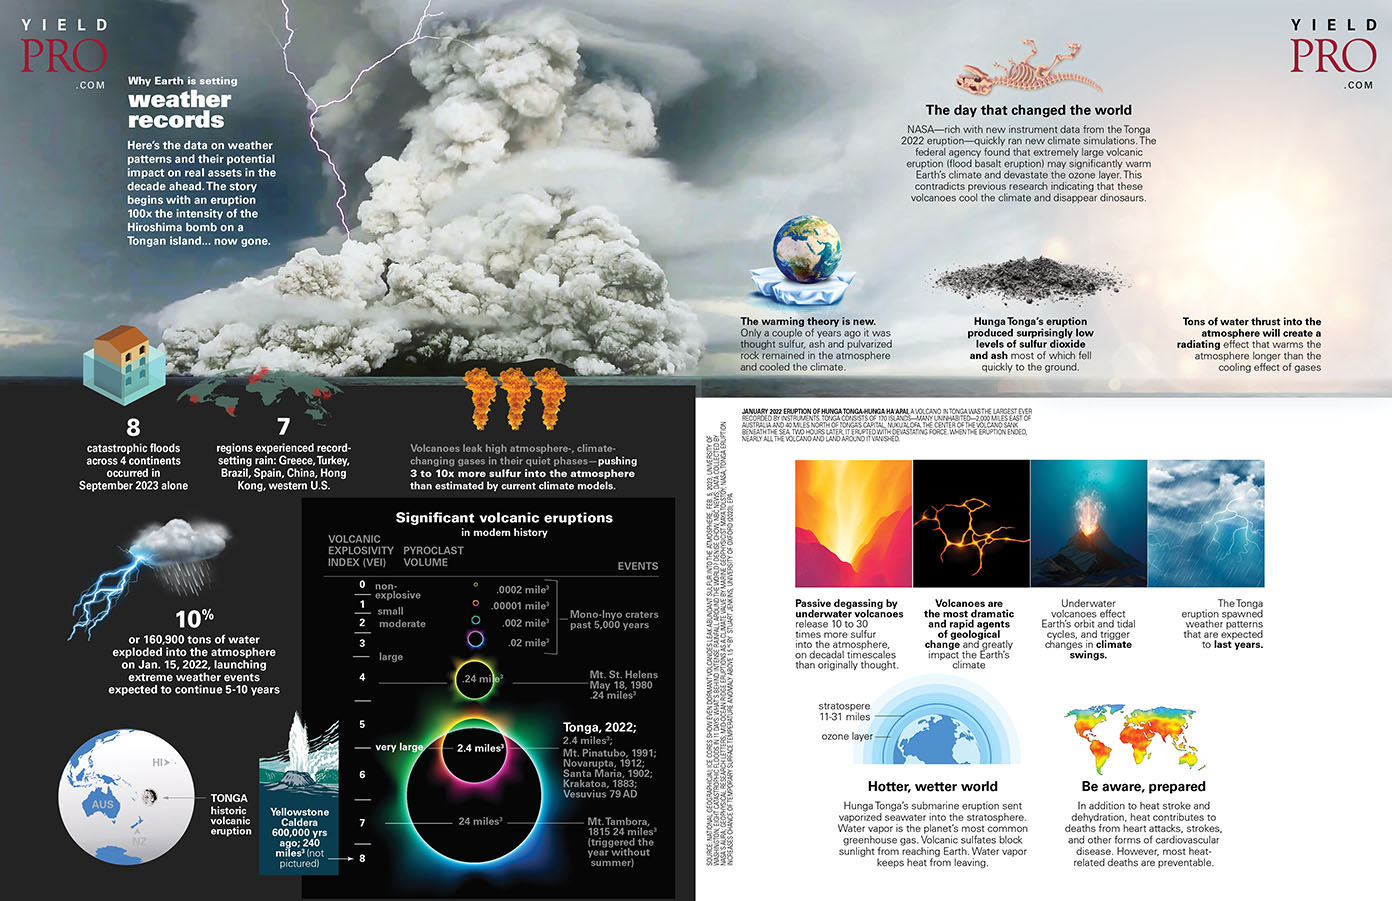
INFOGRAPHIC: Why Earth is setting records
Why Earth is setting weather records
Here’s the data on weather patterns and their potential impact on real assets in the decade ahead. The story...
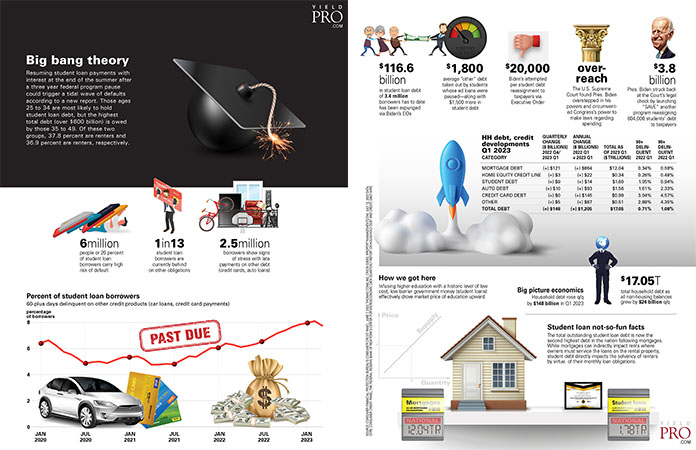
Infographic: Big bang theory
Resuming student loan payments with interest at the end of the summer after a three year federal program pause could trigger a tidal wave...
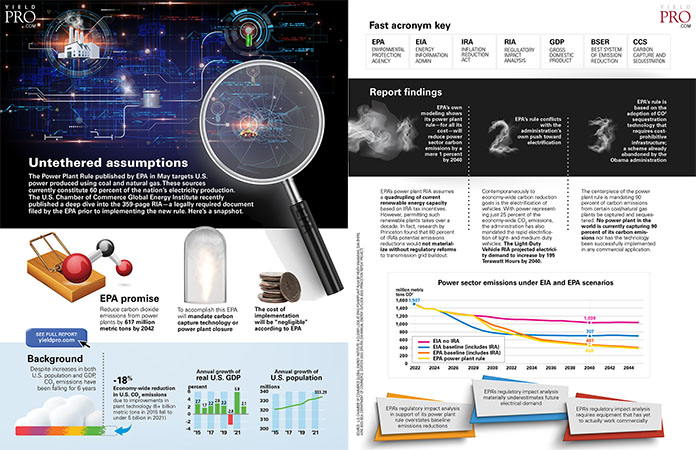
Infographic: Untethered assumptions
The Power Plant Rule published by EPA in May targets U.S. power produced using coal and natural gas. These sources currently constitute 60 percent...
Infographic: Sudden immigrant impact
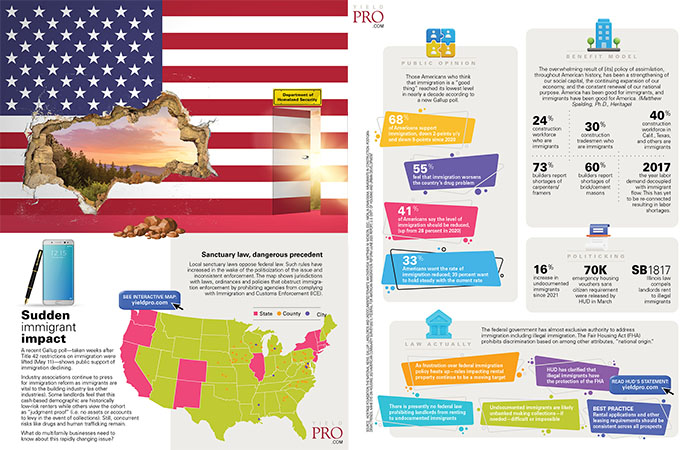
A recent Gallup poll—taken weeks after Title 42 restrictions on immigration were lifted (May 11)—shows public support of immigration declining.
Industry associations continue to press...
Infographic: Discrimination domino effect
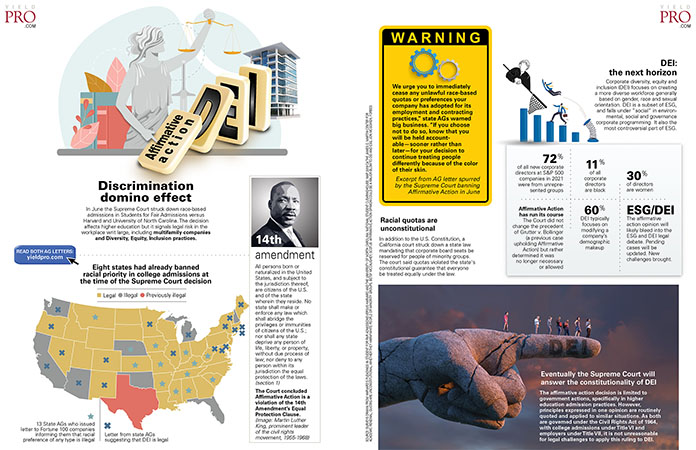
In June the Supreme Court struck down race-based admissions in Students for Fair Admissions versus Harvard and University of North Carolina. The decision affects...
Infographic: Breaking buildings
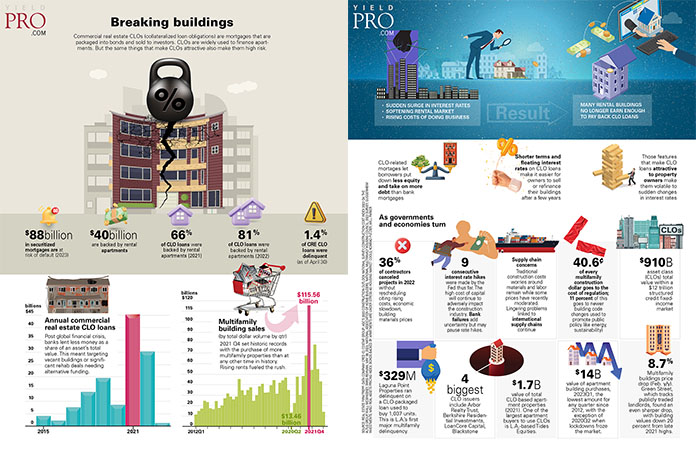
Breaking buildings Commercial real estate CLOs (collateralized loan obligations) are mortgages that are packaged into bonds and sold to investors. CLOs are widely used...
Infographic: Happy. Happy. Happy.
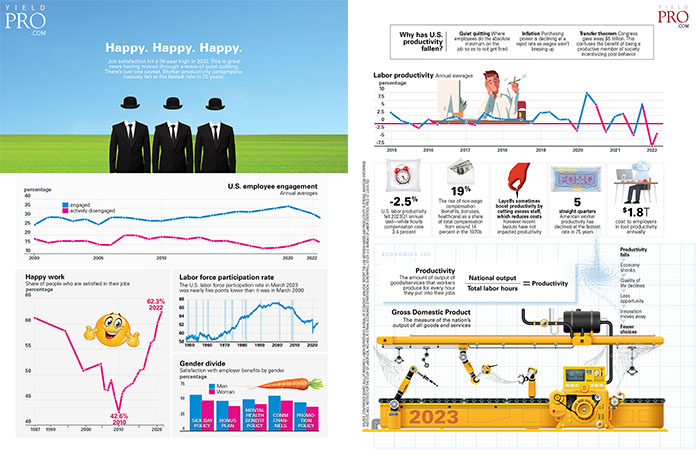
Happy. Happy. Happy. Job satisfaction hit a 36-year high in 2022. This is great news having moved through a wave of quiet quitting. There’s...
Infographic: The path less sustainable
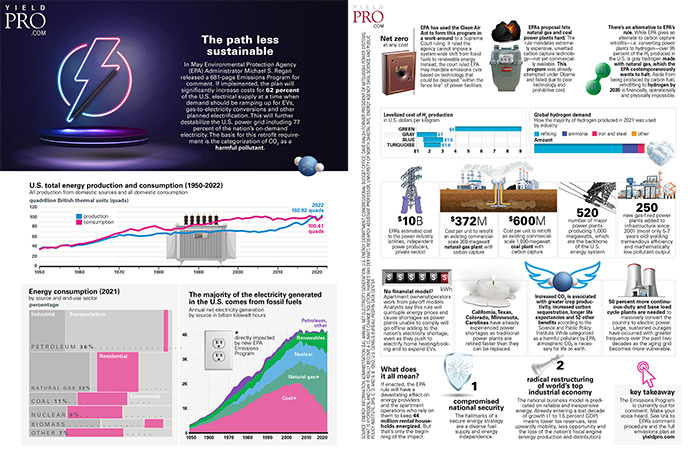
In May Environmental Protection Agency (EPA) Administrator Michael S. Regan released a 681-page Emissions Program for comment. If implemented, the plan will significantly increase...
Infographic: GDP MSA
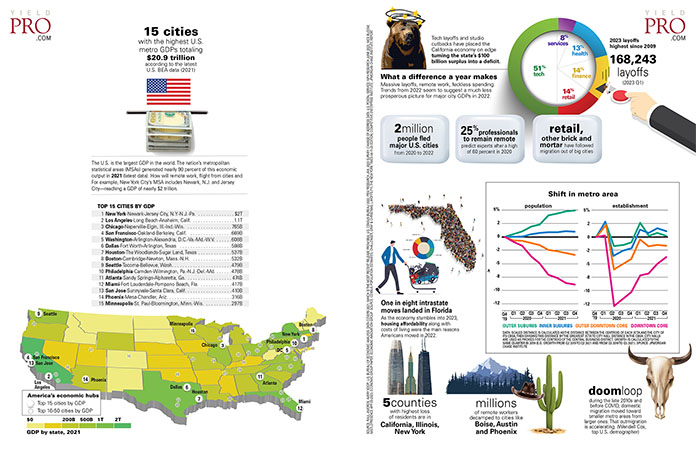
15 cities with the highest U.S. metro GDPs totaling $20.9 trillion according to the latest U.S. BEA data (2021)
The U.S. is the largest GDP...
Infographic: Top U.S. Banks by uninsured deposits
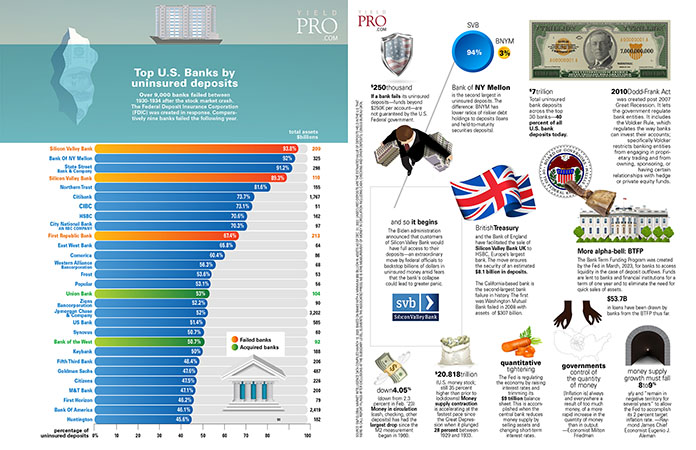
Over 9,000 banks failed between 1930-1934 after the stock market crash. The Federal Deposit Insurance Corporation (FDIC) was created in response. Comparatively nine banks...
Infographic: CRE pivot
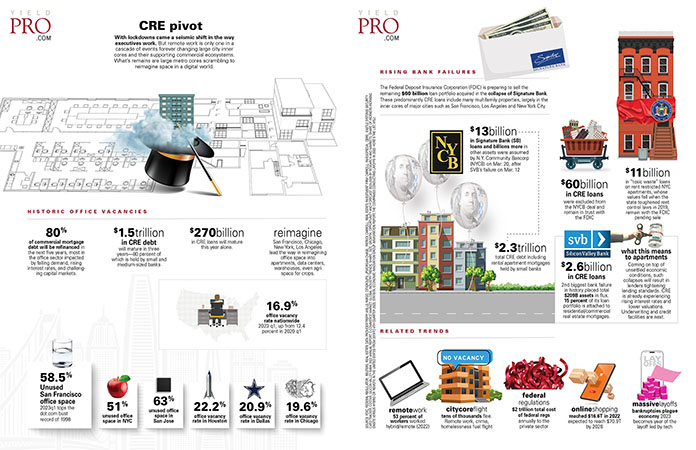
With lockdowns came a seismic shift in the way executives work. But remote work is only one in a cascade of events forever changing...
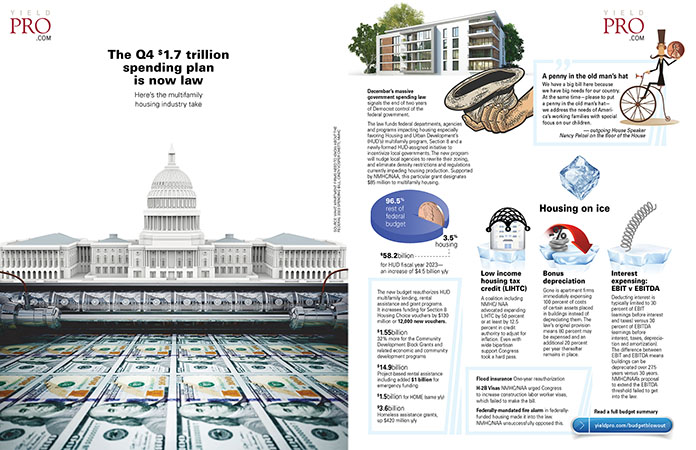
Infographic: The Q4 $1.7 trillion spending plan is now law
Here’s the multifamily housing industry take
December’s massive government spending law signals the end of two years of Democrat control of the federal government.
The law...
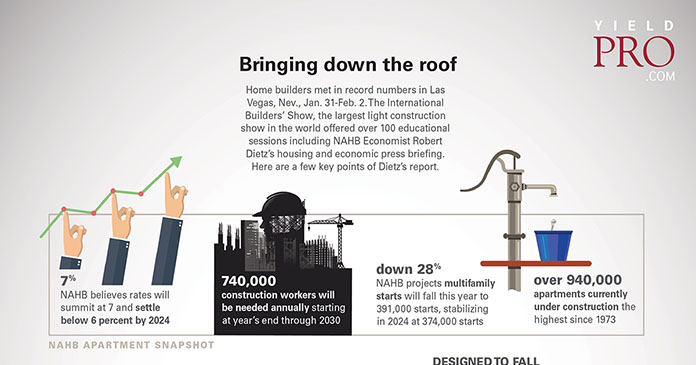
Infographic: Bringing down the roof
Home builders met in record numbers in Las Vegas, Nev., Jan. 31-Feb. 2. The International Builders’ Show, the largest light construction show in the...
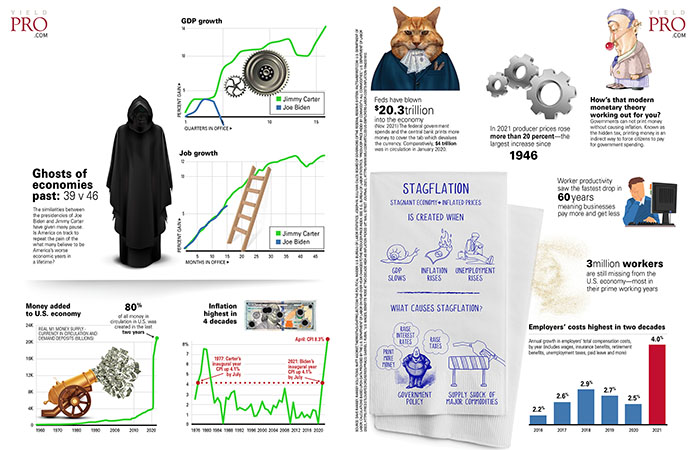
Infographic: Stagflation
Ghosts of economies past: 39 v 46
The similarities between the presidencies of Joe Biden and Jimmy Carter have given many pause. Is America on...


