The Mortgage Bankers’ Association (MBA) recently released its Q2 2022 quarterly databook. It contains some data that has been previously discussed here and here, but it also includes new forecasts for key economic metrics through 2024.
Assessing the economy
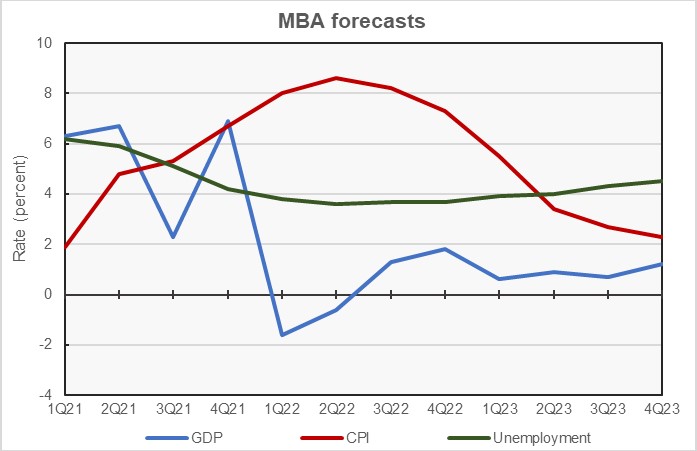
The first chart, below, contains the MBA’s forecasts for several key economic metrics. Quarterly forecasts are provided through the end of 2023 and annual forecasts are provided through 2024.

The MBA forecast calls for GDP growth to recover from its drops in Q1 and Q2, returning to positive growth in Q3. While it sees economic growth slowing significantly in late 2023, it sees growth remaining positive throughout that year. The MBA’s relative optimism leaves Fannie Mae’s forecasters as being the most pessimistic on the prospects for the economy in 2023. Unfortunately, their relative pessimism has so far made their forecasts closer to the mark than other forecasts.
By the numbers, the MBA is calling for GDP growth of 0.2 percent in 2022, 0.9 percent in 2023 and 1.3 percent in 2024. These are down from rates of 1.6 percent in 2022, 1.9 percent in 2023 and 1.5 percent in 2024 forecast last quarter. This is the second quarterly forecast in a row where the growth forecasts for all three years covered were revised significantly lower.
As in the last report, the outlook for inflation as measured by the Consumer Price Index (CPI) is for year-over-year price increases to crest in Q2 and then to slowly fall. However, the peak of the crest is now expected to be higher and the decline from the peak is expected to take longer than was forecast last quarter. The MBA predicts that inflation will return to the Fed’s target of 2 percent only late in 2024.
By the numbers, the MBA is calling for Q4 year-over-year CPI growth of 7.3 percent in 2022, 2.3 percent in 2023 and 2.0 percent in 2024. These are revised from rates of 5.4 percent in 2022, 2.7 percent in 2023 and 2.3 percent in 2024 forecast last quarter.
The Q2 report calls for the unemployment rate to continue to fall through the middle of 2022 but to rise starting in Q3 2020 as the economy reacts to higher interest rates. Unemployment now is expected to be 4.2 percent in 2023, up from the 3.7 percent forecast last quarter. It is now expected to rise to 4.9 percent in 2024, compared to the 4.3 percent forecast in last quarter’s databook.
Interest rates move higher
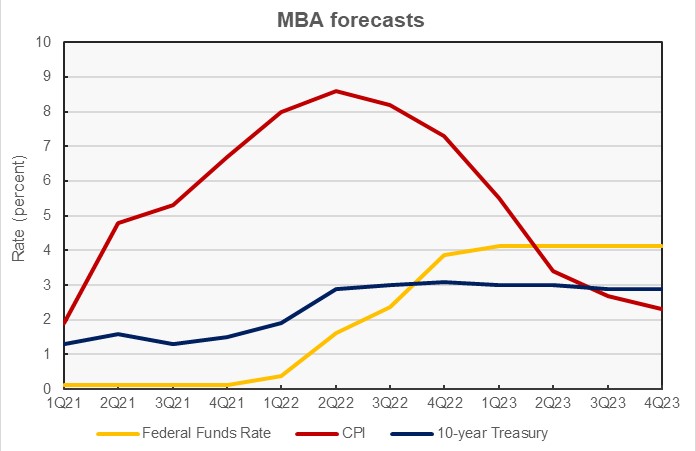
The MBA forecasts for two key interest rates are plotted in the next chart, along with that of the CPI repeated for reference. The forecast calls for the Federal Funds rate to rise through the end of 2023 but, unlike last quarter’s databook, it no longer projects the Federal Funds rate to fall in 2024.

The chart shows that a rate inversion between the 10-year Treasury and the Fed Funds rate is now expected to occur by Q4 2022. The previous forecast had projected this occurring two quarters later. This yield curve inversion is expected to be sustained for more than a year. This inversion is often a precursor to a recession, although the forecast in the databook does not actually project that a recession will occur.
Tracking the apartment market
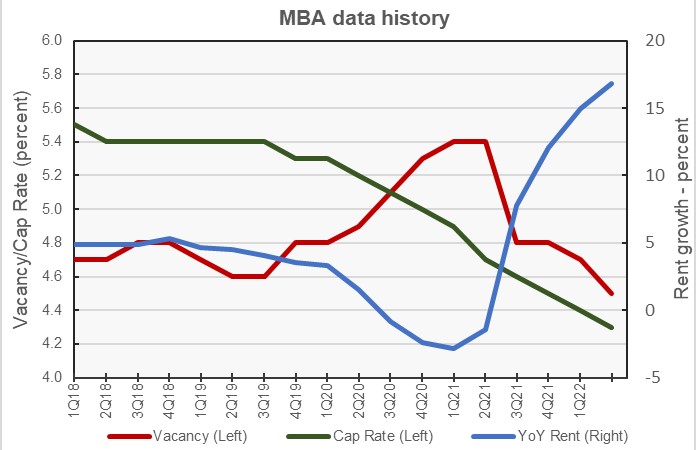
The report also includes historical data on closely tracked industry metrics. These are shown in the next chart, below. The data are plotted on different scales so that the relations between the changes in the metrics are more visible. The most recent data on these metrics is for Q2 2022. Other sources for similar data report their results monthly, so the MBA’s data is less current. However, it is interesting to note differences between the data sources.

The chart shows that the vacancy rate has been falling from its pandemic highs since Q2 2021. By contrast, Apartment List reports that the vacancy rate has been trending upward since late 2021.
The MBA report shows the year-over-year rent growth rate moved sharply higher starting in Q2 2021. The report does not show this rent growth rate declining yet. Other sources show that it has been falling since late Q2 2022, a period not yet covered in the MBA report.
The chart also shows that the cap rate for multifamily property continuing to trend lower over the past 5 years, with no sign yet that it is moving higher in response to the environment of higher interest rates.
The full databook contains information on lending for other commercial property types and on real estate sales activity. The report can be found here.


