The Mortgage Bankers’ Association (MBA) recently released its Q3 2022 quarterly databook. It contains data on mortgage originations and on holdings that has been previously discussed. It also includes new forecasts for key economic metrics through 2025.
Assessing the economy
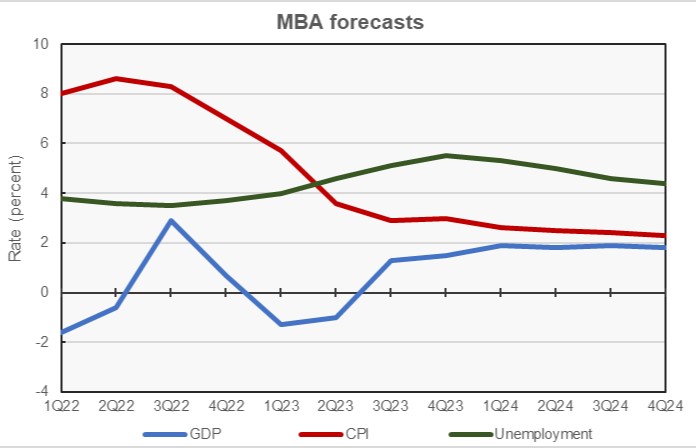
The first chart, below, contains the MBA’s forecasts for several key economic metrics. In the latest databook, quarterly forecasts are provided through the end of 2024 and annual forecasts are provided through 2025.

The MBA forecast calls for GDP growth to be positive in the second half for 2022. However, the economy is predicted to contract in the first half of 2023 before returning to growth in Q3. The forecast in the Q2 2022 databook had called for positive GDP growth in every quarter of 2023, so the new forecast reflects increased pessimism about economic growth prospects in 2023.
By the numbers, the MBA is calling for GDP growth of 0.3 percent in 2022, 0.1 percent in 2023, 1.8 percent in 2024 and 1.6 percent in 2025. The annual forecast for 2023 is down from the 0.9 percent growth forecast last quarter, but the forecasts for 2022 and 2024 were actually revised higher since the release of last quarter’s databook.
As in the last two quarterly databooks, the forecast for inflation as measured by the Consumer Price Index (CPI) is for year-over-year price increases to crest in Q2 2022 and then to slowly fall. However, the decline from the peak is now expected to be more gradual than was forecast last quarter. The MBA predicts that inflation will fall to only 2.1 percent by the end of 2025, just slightly above the Fed’s target of 2.0 percent.
By the numbers, the MBA is calling for Q4 year-over-year CPI growth of 7.0 percent in 2022, 3.0 percent in 2023, 2.3 percent in 2024 and 2.1 percent in 2025. These are revised from rates of 7.3 percent in 2022, 2.3 percent in 2023 and 2.0 percent in 2024 forecast last quarter.
The Q3 databook calls for the unemployment rate to continue to fall from its pandemic highs through Q3 2022. It is then predicted to rise as the economy reacts to higher interest rates, peaking in Q4 2023. Unemployment now is expected to be 4.8 percent in 2023, up from the 4.2 percent forecast last quarter. It is now expected to rise to 4.8 percent in 2024, compared to the 4.9 percent forecast in last quarter’s databook. The initial forecast for 2025 is for an unemployment rate of 4.2 percent.
Interest rates move higher
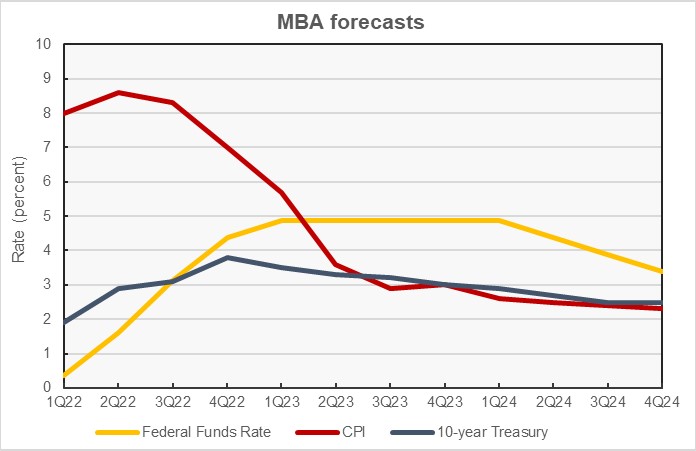
The MBA forecasts for two key interest rates are plotted in the next chart, along with that of the CPI for reference. The new forecast reflects the aggressive actions on interest rates the Federal Reserve took in 2022. It calls for the Federal Funds rate to rise higher than in earlier forecasts and to remain at a high level through the middle of 2024.

The chart shows that a rate inversion between the 10-year Treasury and the Fed Funds rate is now expected to occur in Q4 2022. The rate on the 10-year Treasury is expected to remain above the Fed Funds rate through the end of 2024. This inversion between shorter and longer-term interest rates is often a precursor to a recession, and it is consistent with the downturn the databook predicts for the first half of 2023.
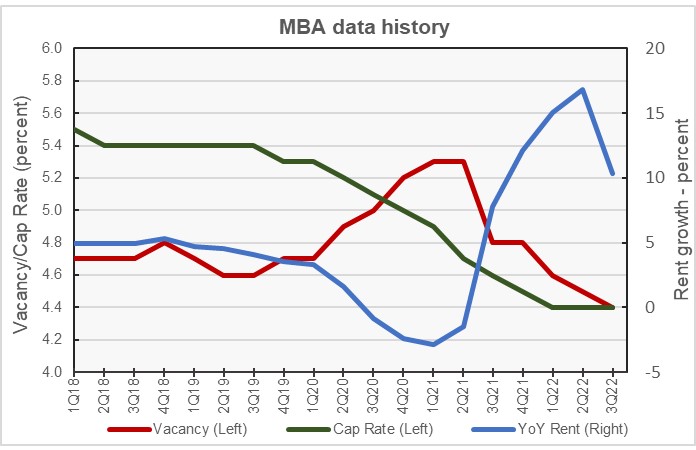
The report also includes historical data on other closely tracked industry metrics. These are shown in the next chart, below. The data are plotted on different scales so that the relations between the changes in the metrics are more visible. The most recent data on these metrics is for Q3 2022.

The data from the MBA, which is sourced from REIS, indicates that the vacancy rate has been falling from its pandemic highs since Q2 2021. By contrast, Apartment List reports that, after peaking in the late spring of 2020, the vacancy rate has been trending upward since late 2021. Yardi Matrix also reports that the apartment vacancy rate is up over the last year.
The MBA report showed that the year-over-year rent growth rate moved sharply higher starting in Q2 2021 and only began to decline in Q3 2022. Data from both Apartment List and Yardi Matrix indicate that the year-over-year rate of increase in apartment rents peaked at the end of 2021 and has been falling since then.
The chart also shows that the cap rate for multifamily property continuing to trend lower over the past 5 years, with no sign yet that it is moving higher in the environment of higher interest rates.
The full databook contains information on lending for other commercial property types and on real estate sales activity. The report can be found here.


