Tag: PRO Visualization
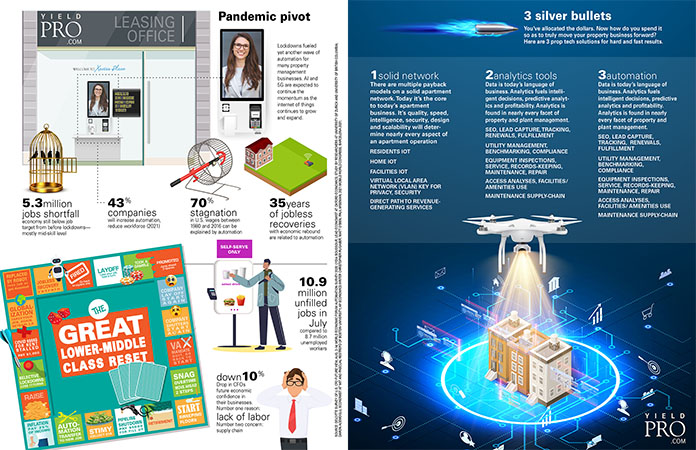
Infographic: Pandemic pivot
Lockdowns fueled yet another wave of automation for many property management businesses. AI and 5G are expected to continue the momentum as the internet...
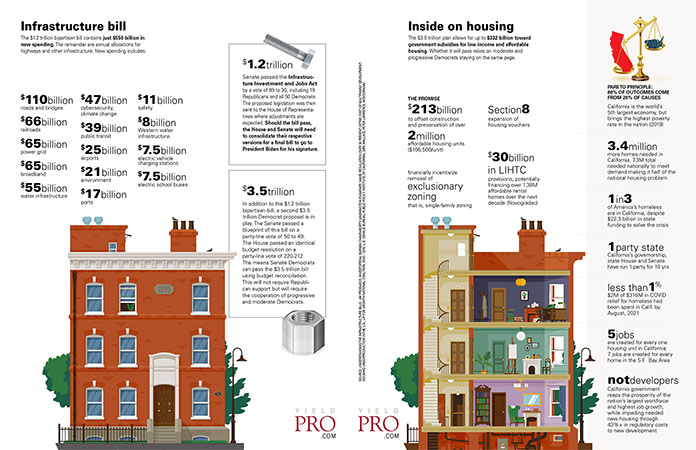
Infographic: Infrastructure bill
The $1.2 trillion bipartisan bill contains just $550 billion in new spending. The remainder are annual allocations for highways and other infrastructure. New spending...
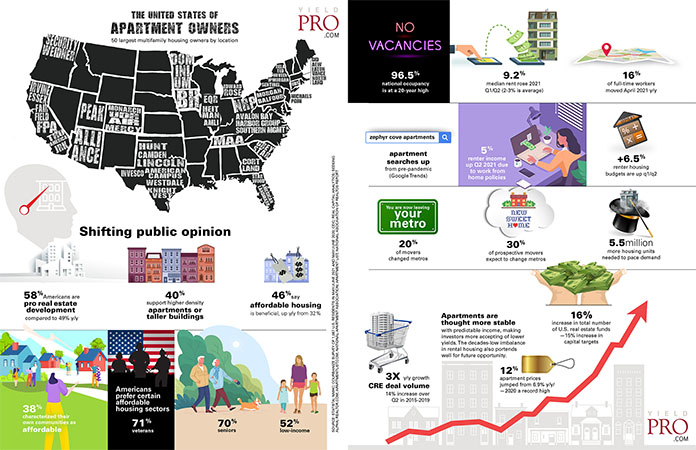
Infographic: The United States of apartment owners
50 largest multifamily housing owners by location
Shifting public opinion
58% Americans are pro real estate development compared to 49% y/y
40% support higher density apartments or...
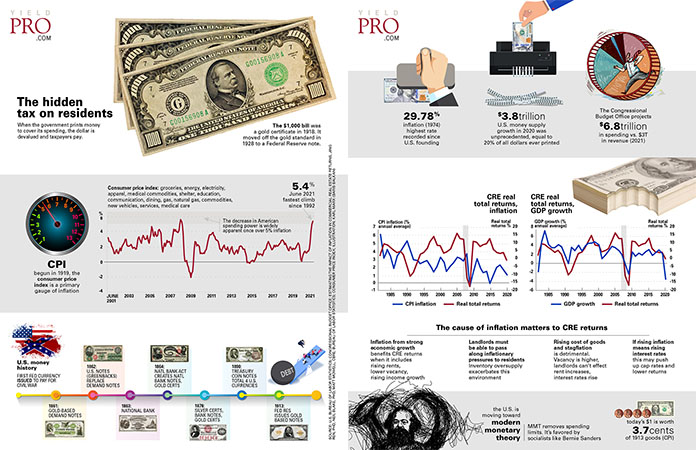
Infographic: The hidden tax on residents
When the government prints money to cover its spending, the dollar is devalued and taxpayers pay.
The $1,000 bill was a gold certificate in 1918....
Infographic: Man-made chaos
State-mandated lockdowns began a cascade that especially devastated lower income people and continues to adversely impact the business of property management.
Government interference
with the ability...
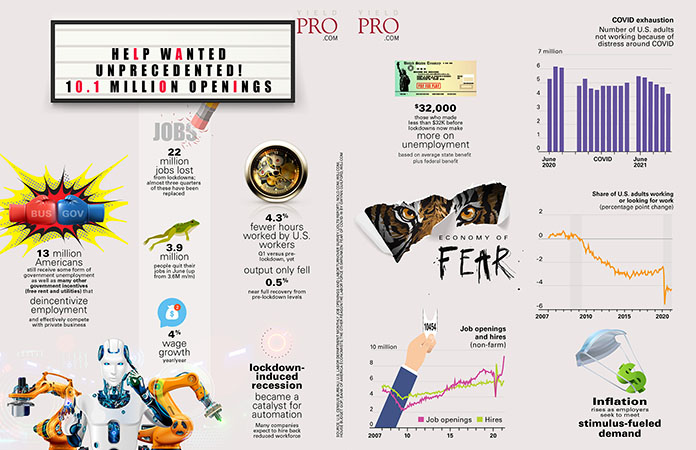
Infographic: Help wanted
Unprecedented! 10.1 million openings
Jobs
22 million jobs lost from lockdowns; almost three quarters of these have been replaced
13 million Americans still receive some form of...
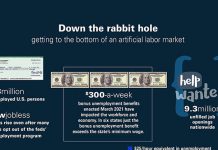
Infographic: Down the rabbit hole
Getting to the bottom of an artificial labor market
3 million unemployed U.S. persons
New jobless claims rise even after many states opt out...
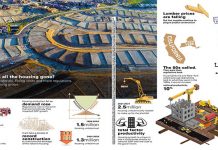
Infographic: Where has all the housing gone?
No labor. No materials. Rising costs and more regulations. The lack of housing grows.
5 million more housing units needed to pace demand
5...
Infographic: The changing American dream
Homeownership peaked at 69% in 2004, then fell for years thereafter before rebounding in 2020 to 66%. Fundamentals are set to change the business...
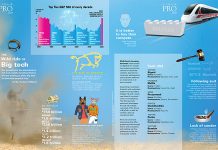
Infographic: The wild ride of Big Tech
Our government has abandoned a rich and socially beneficial history of trust-busting to allow big tech to dominate people’s lives.
Tim Wu, The Curse of...
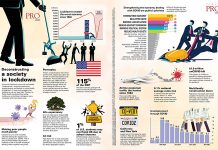
Infographic: Deconstructing a society in lockdown
Economic lockdowns come with unintended consequences—economic destruction, surging poverty and decline in mental health among them. A new study suggests the lockdowns may not...
Infographic: Flying post pan
It’s inevitable. Trade show organizers are revving their engines, ready to roar back.
Maybe you’ve already dared jump on a plane to wait out the...
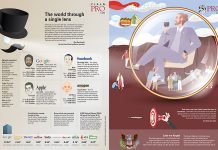
Infographic: The world through a single lens
Facebook says we don’t like this, and Twitter says we don’t like attacks on Hunter Biden. Once you act as a publisher, you’re a...
Infographic: C19 winners and losers
ZOOM
video conferencing, San Jose, Calif.
$664 million revenue growth May to June, driving Y/Y profits from $5.5 million to $186 million
AMAZON
e-commerce, Seattle,...
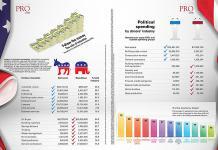
Infographic: Follow the money
The color of industries
Donations to candidates and candidate PACs
Political spending by donors’ industry
Donations to super PACs and outside spending groups
Partisan industries
Democrat
Republican
% total industry
Industrial unions
$8,213,414
$355,207
95.9
Internet
26,825,046
3,433,577
88.7
Publishing
27,887,021
4,452,566
86.2
Building...


