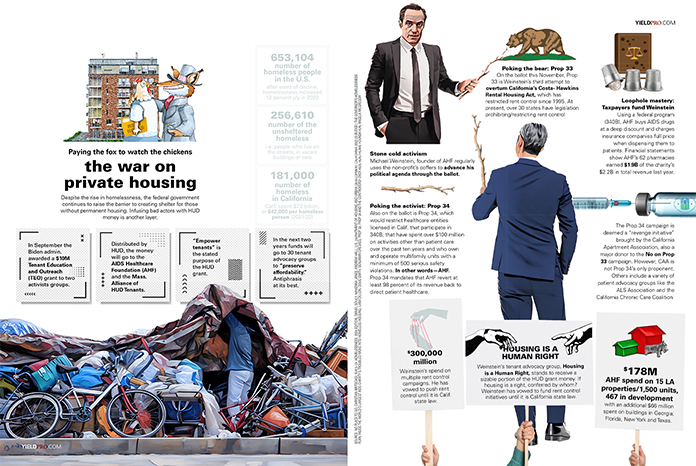
Paying the fox to watch the chickens: The war on private housing
Despite the rise in homelessness, the federal government continues to raise the barrier to creating shelter for those without permanent housing. Infusing bad actors with HUD money is another layer.
In September the Biden admin....
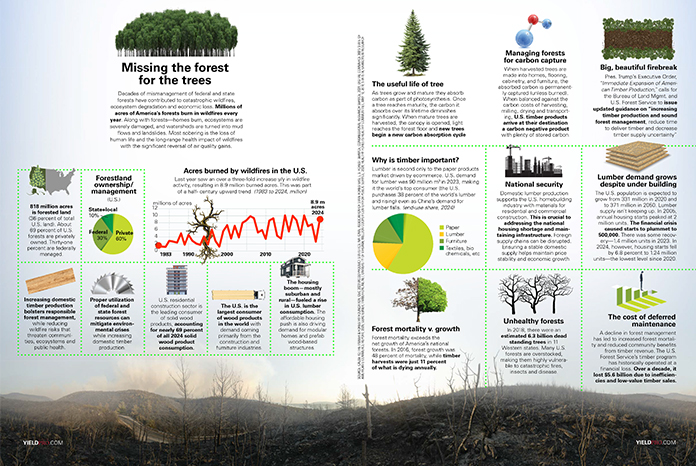
Missing the forest for the trees
Decades of mismanagement of federal and state forests have contributed to catastrophic wildfires, ecosystem degradation and economic loss. Millions of acres of America’s forests burn in wildfires every year. Along with forests—homes burn, ecosystems...
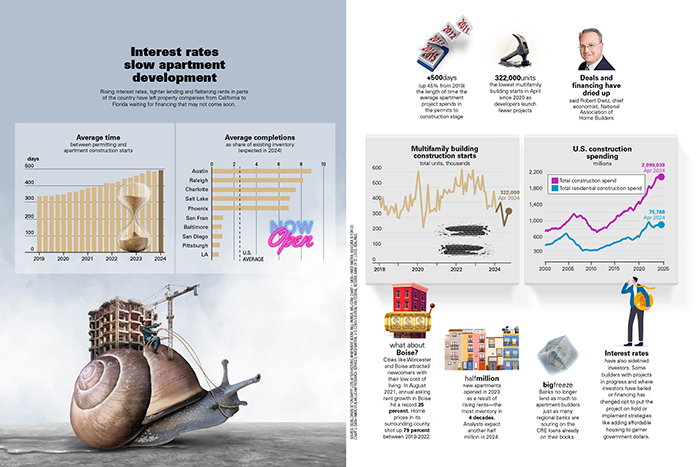
INFOGRAPHIC: Interest rates slow apartment development
Rising interest rates, tighter lending and flattening rents in parts of the country have left property companies from California to Florida waiting for financing that may not come soon.
+500 days (up 45% from 2019)...
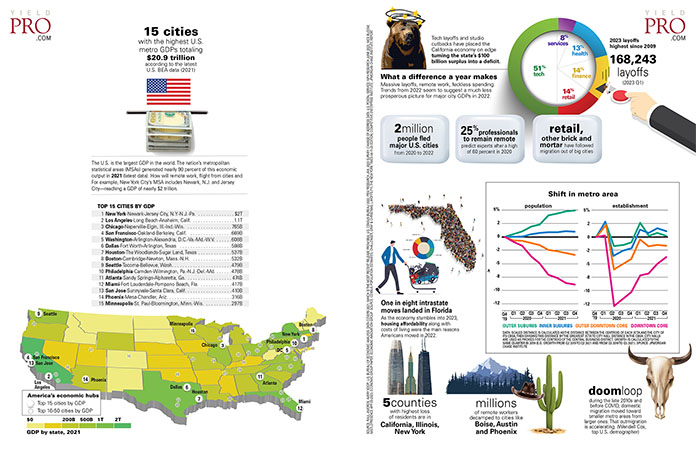
Infographic: GDP MSA
15 cities with the highest U.S. metro GDPs totaling $20.9 trillion according to the latest U.S. BEA data (2021)
The U.S. is the largest GDP in the world. The nation’s metropolitan statistical areas (MSAs) generated...
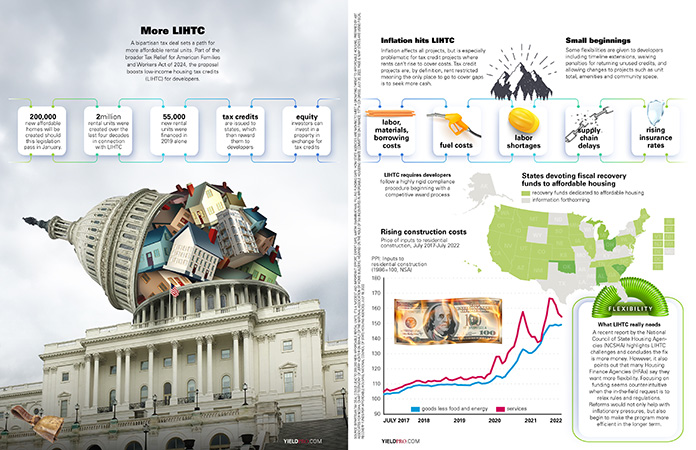
INFOGRAPHIC: More LIHTC
A bipartisan tax deal sets a path for more affordable rental units. Part of the broader Tax Relief for American Families and Workers Act of 2024, the proposal boosts low-income housing tax credits (LIHTC)...
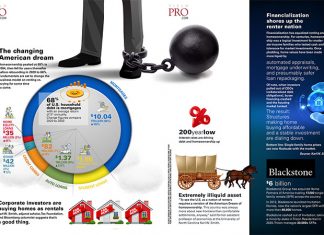
Infographic: The changing American dream
Homeownership peaked at 69% in 2004, then fell for years thereafter before rebounding in 2020 to 66%. Fundamentals are set to change the business model on renting vs. buying for some time to come.
Corporate...
Infographic: California’s circular housing crisis
"Get me a good package on rent stability this year and I will sign it," Newsom said in his State of the State address in February. This wouldn't be the first time the state...
The jobs that pay the rent
Trump’s promise to “bring back Main Street” is certain to impact the dynamic of U.S. jobs. Treasury Secretary Scott Bessent outlined the plan: shrink government, reduce national debt, boost private sector growth using tax...
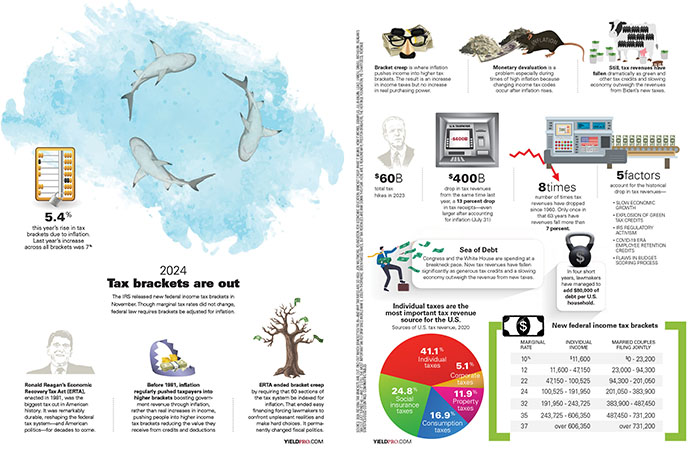
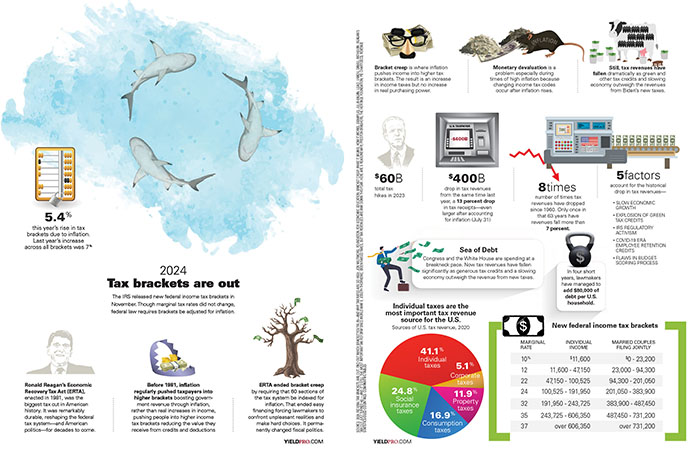
INFOGRAPHIC: 2024 Tax brackets are out
The IRS released new federal income tax brackets in November. Though marginal tax rates did not change, federal law requires brackets be adjusted for inflation.
5.4%
this year’s rise in tax brackets due to inflation. Last...
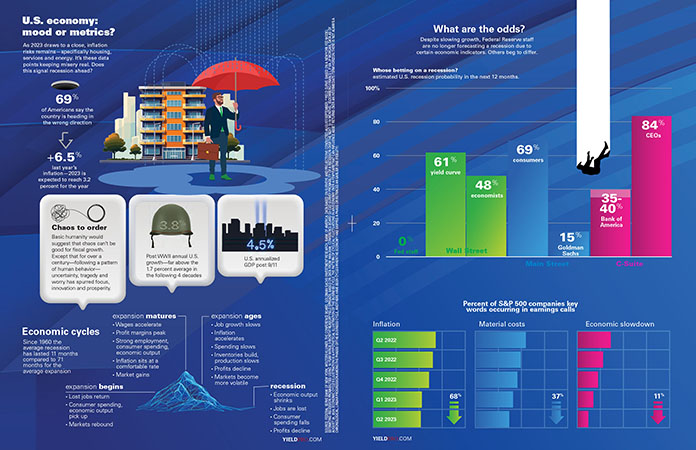
INFOGRAPHIC: U.S. economy: mood or metrics?
As 2023 draws to a close, inflation risks remains—specifically housing, services and energy. It’s these data points keeping misery real. Does this signal recession ahead?
69% of Americans say the country is heading in the...
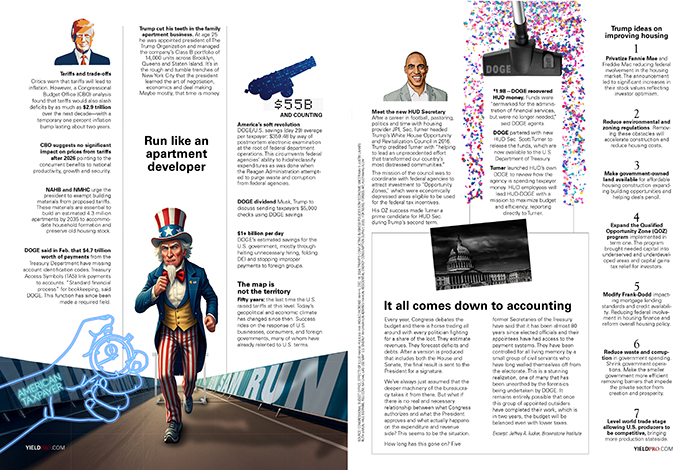
Run like an apartment developer
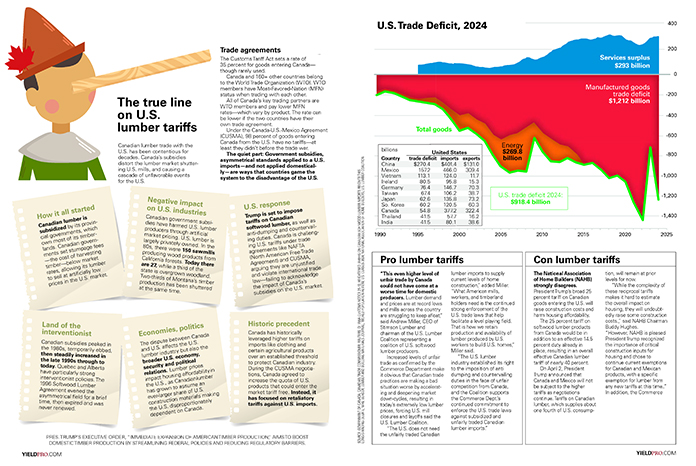
Tariffs and trade-offs
Critics warn that tariffs will lead to inflation. However, a Congressional Budget Office (CBO) analysis found that tariffs would also slash deficits by as much as $2.9 trillion over the next decade—with...
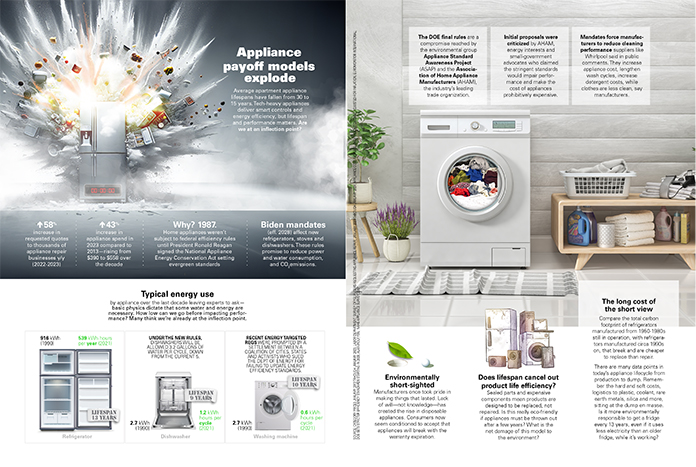
INFOGRAPHIC: Appliance payoff models explode
^58 percent increase in requested quotes to thousands of appliance repair businesses y/y (2022-2023)
^43 percent increase in appliance spend in 2023 compared to 2013—rising from $390 to $558 over the decade
Why? 1987. Home appliances...
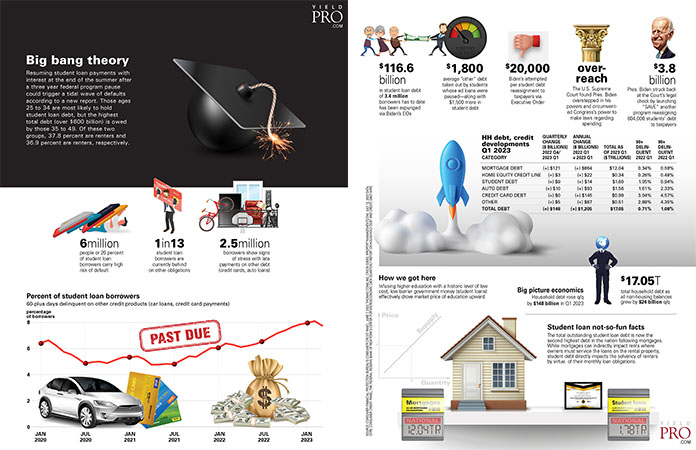
Infographic: Big bang theory
Resuming student loan payments with interest at the end of the summer after a three year federal program pause could trigger a tidal wave of defaults according to a new report. Those ages 25...
INFOGRAPHIC: Can governments use building permits to extort property owners?
The Supreme Court will hear a landmark property-rights case (Sheetz v. County of El Dorado) with major economic implications. When a decision will be made is unclear; Chevron was originally ruled on June 25,...
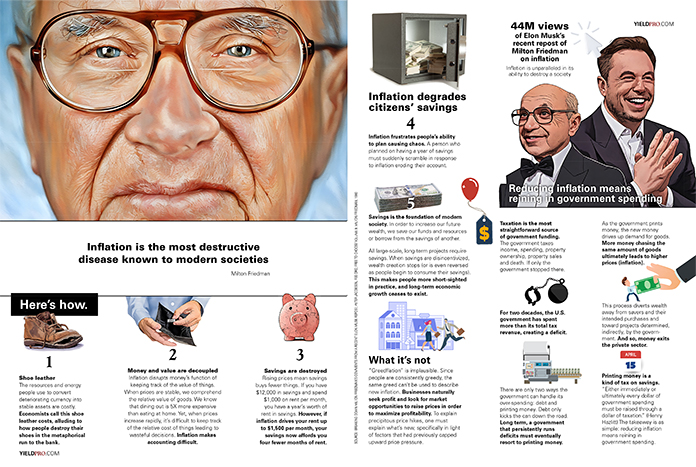
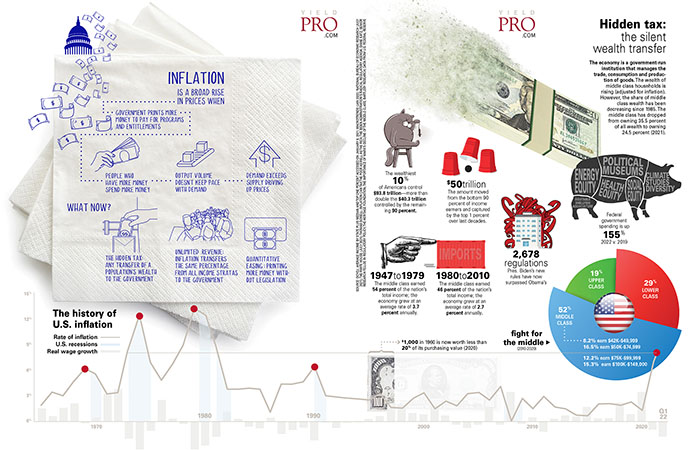
Infographic: Inflation
Inflation is a broad rise in prices when
Government prints more money to pay for programs and entitlements
People who have more money spend more money
Output volume doesn’t keep pace with demand
...


