Infographic: Social credit scores in America?
Social credit will shift law in the west “from constitution to analytics and algorithm'
—Penn State professor
Will AI-driven social scores supplant the constitution? Professor Larry Backer of Penn State University writes in a 2018 paper...
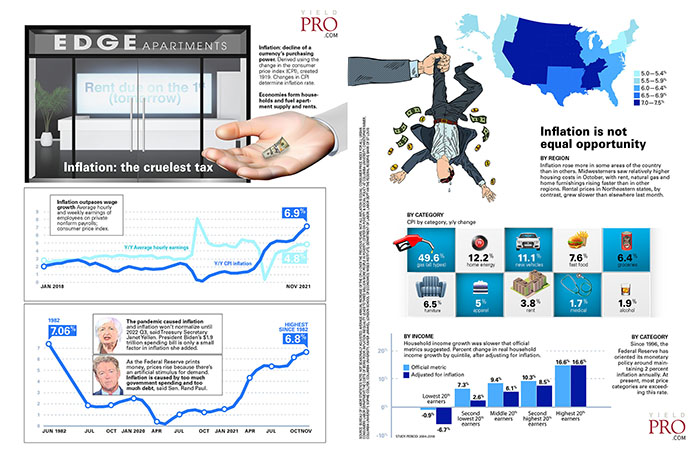
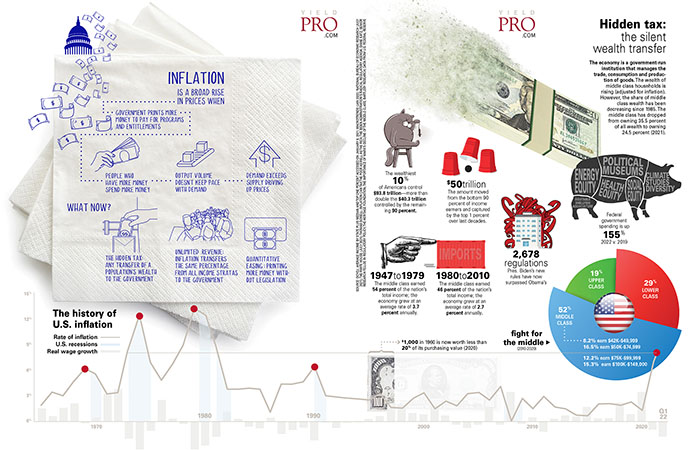
Infographic: Inflation, the cruelest tax
Inflation: decline of a currency’s purchasing power. Derived using the change in the consumer price index (CPI), created 1919. Changes in CPI determine inflation rate.
Economies form households and fuel apartment supply and rents.
Inflation...
Infographic: California’s circular housing crisis
"Get me a good package on rent stability this year and I will sign it," Newsom said in his State of the State address in February. This wouldn't be the first time the state...
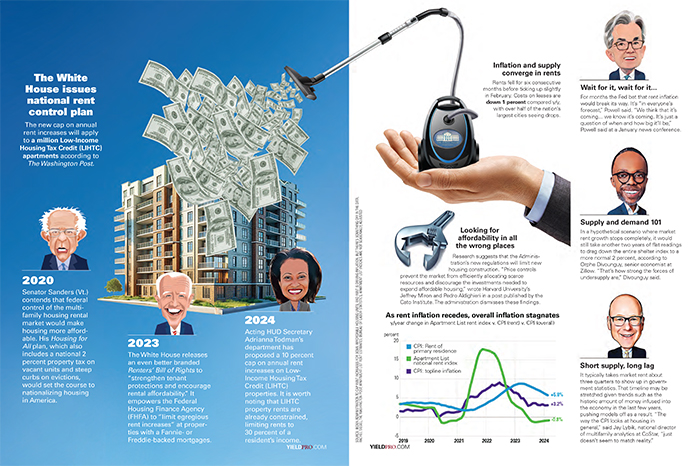
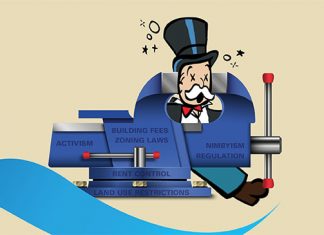
Infographic: Rent control – Getting the squeeze for poor housing policy and stifling regulation
5%+rate of inflation
California state legislators have passed AB 1482 sponsored by Assemblyman David Chiu (d)—San Francisco. The bill limits annual rent increases that commercial single-family homes and apartment landlords may implement to 5% plus...
Infographic: Inflation
Inflation is a broad rise in prices when
Government prints more money to pay for programs and entitlements
People who have more money spend more money
Output volume doesn’t keep pace with demand
...
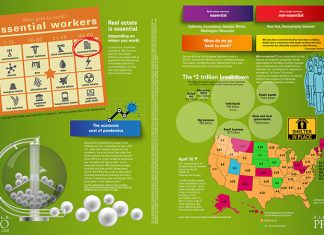
Infographic: Essential workers
Download PDF
Updated: April 16, 2020
Who gets to work?
essential workers
Real estate is essential (depending on where you work)
Construction. Apartment operations. Maintenance services. Real estate functions are categorized as essential in the Department of Homeland Security’s...
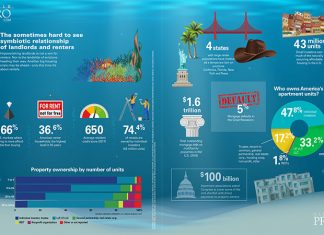
Infographic: Apartment chill
The sometimes hard to see symbiotic relationship of landlords and renters
Impoverishing landlords is not a win for renters. Nor is the landslide of evictions heading their way. Another big housing crisis may be ahead—only...
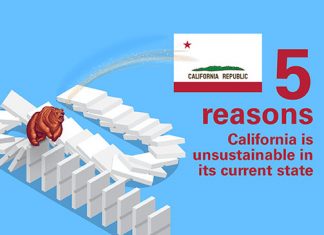
Infographic: Unsustainable California
5 reasons California is unsustainable in its current state
1. Rent control
Several rent control bills failed to make it through the California Senate. AB 1482 (anti-rent gouging bill) did clear the Senate judiciary committee. If...
Infographic: The incredible shrinking American workforce
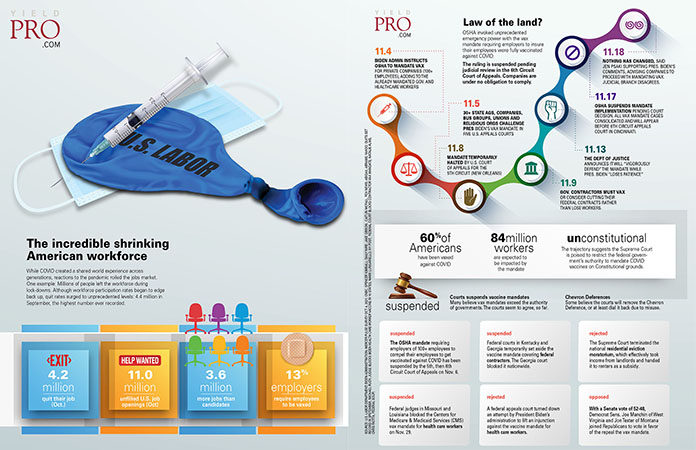
While COVID created a shared world experience across generations, reactions to the pandemic roiled the jobs market. One example: Millions of people left the workforce during lock-downs. Although workforce participation rates began to edge...
Infographic: Let my workers go
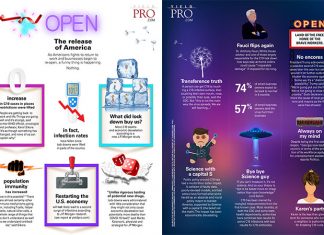
The release of America
As Americans fights to return to work and businesses begin to re-open, a funny thing is happening. Nothing.
0 increase in C19 cases in places restrictions were lifted People are getting back...
Infographic: 21 biases that derail critical thought
Math is perfect. The application of math, however, is contextual. Data science involves human logic. The best data science comes from limited human interaction. Still, data scientists must extrapolate meaning from data in order...
Infographic: The changing American dream
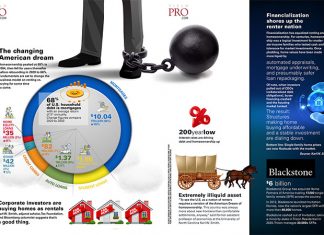
Homeownership peaked at 69% in 2004, then fell for years thereafter before rebounding in 2020 to 66%. Fundamentals are set to change the business model on renting vs. buying for some time to come.
Corporate...
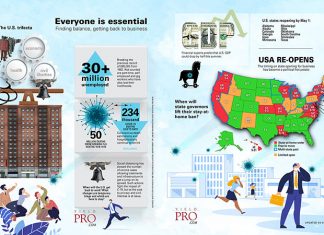
Infographic: Everyone is essential
UPDATED: April 30, 2020
30+ million unemployed
Breaking the previous record of 695,000 from 1982. Not counted are part-time, self—employed and gig workers who have also lost their livelihoods.
50 million deaths from Spanish Flu 1918-1919
234 thousand...
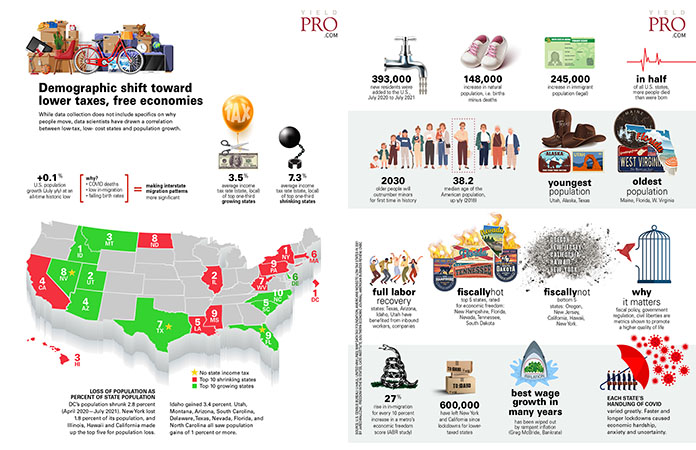
Infographic: Demographic shift toward lower taxes, free economies
While data collection does not include specifics on why people move, data scientists have drawn a correlation between low-tax, low-cost states and population growth.
+0.1% U.S. population growth (July y/y) at an all-time historic low
Why?
...
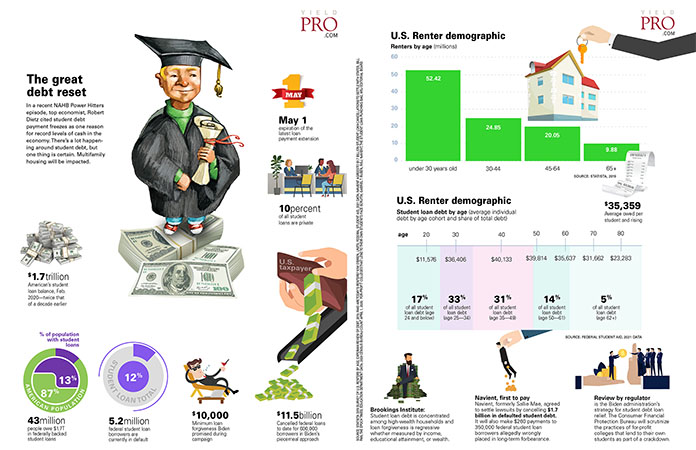
Infographic: The great debt reset
In a recent NAHB Power Hitters episode, top economist, Robert Dietz cited student debt payment freezes as one reason for record levels of cash in the economy. There’s a lot happening around student debt,...


