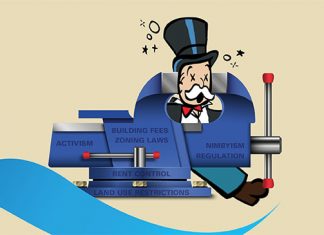
Infographic: Rent control – Getting the squeeze for poor housing policy and stifling regulation
5%+rate of inflation
California state legislators have passed AB 1482 sponsored by Assemblyman David Chiu (d)—San Francisco. The bill limits annual rent increases that commercial single-family homes and apartment landlords may implement to 5% plus...
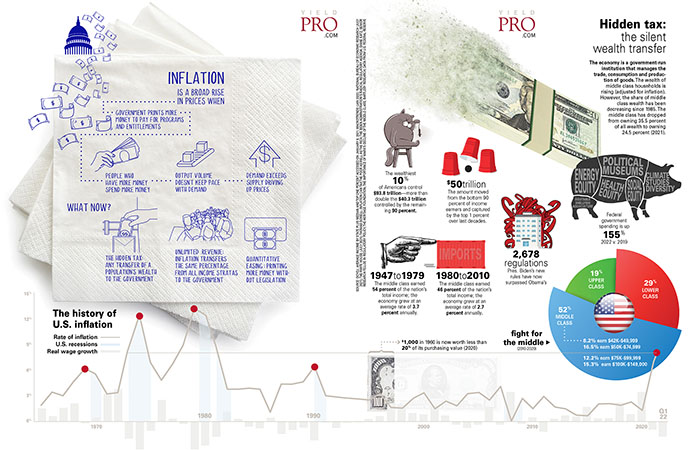
Infographic: Inflation
Inflation is a broad rise in prices when
Government prints more money to pay for programs and entitlements
People who have more money spend more money
Output volume doesn’t keep pace with demand
...
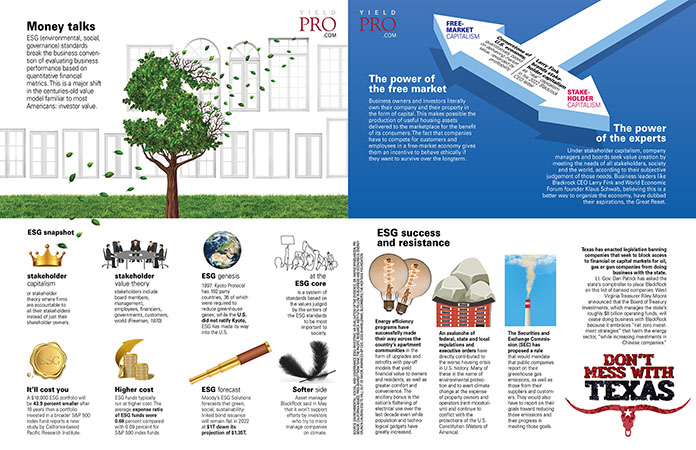
Infographic: Money talks
ESG (environmental, social, governance) standards break the business convention of evaluating business performance based on quantitative financial metrics. This is a major shift in the centuries-old value model familiar to most Americans: investor value.
ESG...
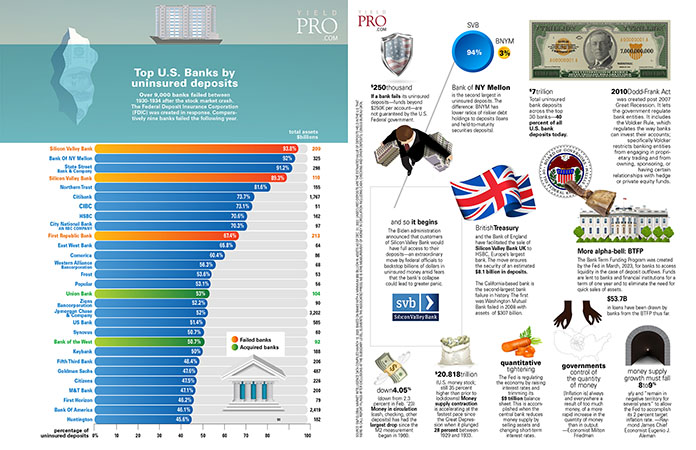
Infographic: Top U.S. Banks by uninsured deposits
Over 9,000 banks failed between 1930-1934 after the stock market crash. The Federal Deposit Insurance Corporation (FDIC) was created in response. Comparatively nine banks failed the following year.
$250 thousand
If a bank fails its uninsured...
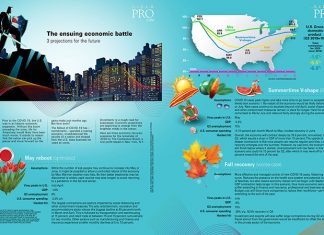
Infographic: The ensuing economic battle
3 projections for the future
Prior to the COVID-19, the U.S. was in an historic economic expansion. Without this boom preceding the crisis, life for Americans would likely have been much worse. It stands to...
INFOGRAPHIC: A luxury vibe
High-income millennials and Gen Zers are choosing Class A apartments over home ownership. Is it a lifestyle choice or the economy?
National Class A rents average $660 to $2,000 below the average monthly mortgage
Hospitality-focused apartments
Class...
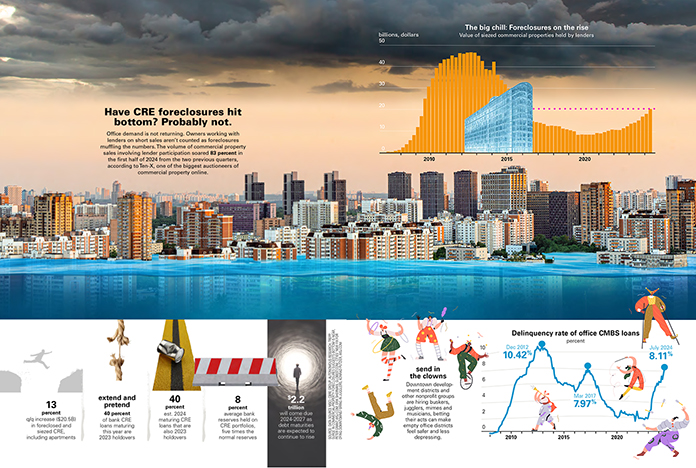
INFOGRAPHIC: Have CRE foreclosures hit bottom? Probably not.
Office demand is not returning. Owners working with lenders on short sales aren’t counted as foreclosures muffling the numbers. The volume of commercial property sales involving lender participation soared 83 percent in the first...
Infographic: Social credit scores in America?
Social credit will shift law in the west “from constitution to analytics and algorithm'
—Penn State professor
Will AI-driven social scores supplant the constitution? Professor Larry Backer of Penn State University writes in a 2018 paper...
Infographic: Man-made chaos
State-mandated lockdowns began a cascade that especially devastated lower income people and continues to adversely impact the business of property management.
Government interference
with the ability to collect rent has left many investors unable to maintain...
ISAs set to transform the labor market
Income share agreement (ISAs) fund education. Upon completion, learners pay a percentage of their salary for a term.
Lenders correlate interest rate and pay-back period with borrower’s potential career outcome.
This may mean varying tuitions for...
Infographic: Comfort creatures
The curious case of comfort animals in apartments
Why pay a pet deposit when you can pass an animal off as a comfort animal? Or maybe a resident wants to circumvent a no-pet policy. The...
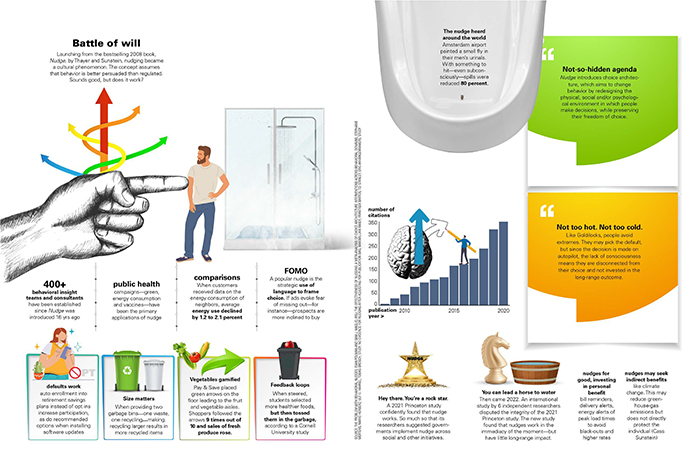
INFOGRAPHIC: Battle of will
Launching from the bestselling 2008 book, Nudge, by Thayer and Sunstein, nudging became a cultural phenomenon. The concept assumes that behavior is better persuaded than regulated. Sounds good, but does it work?
400+ behavioral insight...
Infographic: Quantum supremacy
The man in the machine
Programmed by humans, algorithms begin with a logic tree specifying every facet of the code’s behavior from content prioritization to blacklisting. With Google’s near monopoly, what hangs in the...
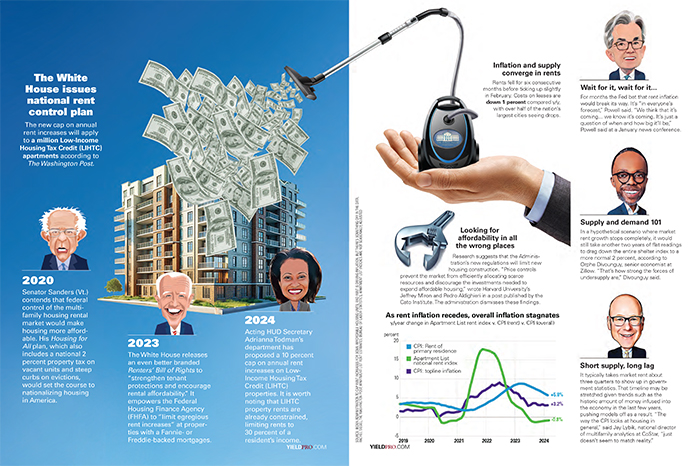
INFOGRAPHIC: The White House issues national rent control plan
download pdf
The new cap on annual rent increases will apply to a million Low-Income Housing Tax Credit (LIHTC) apartments according to The Washington Post.
2020 Senator Sanders (Vt.) contends that federal control of the multifamily...
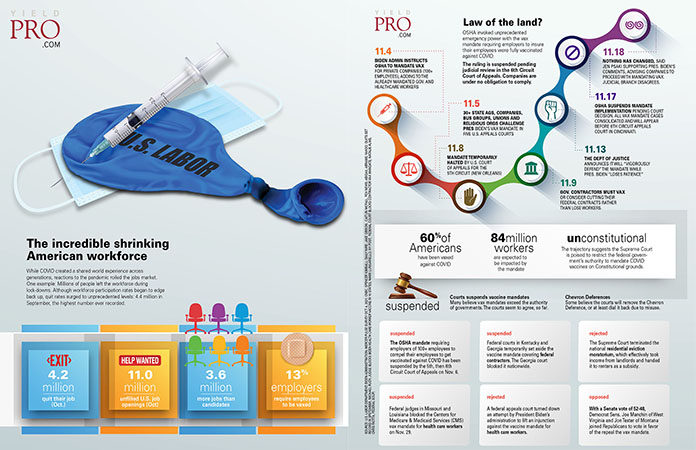
Infographic: The incredible shrinking American workforce
While COVID created a shared world experience across generations, reactions to the pandemic roiled the jobs market. One example: Millions of people left the workforce during lock-downs. Although workforce participation rates began to edge...


