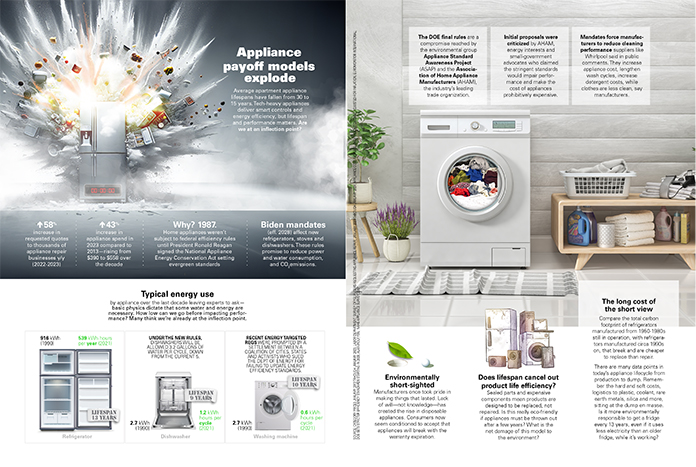
INFOGRAPHIC: Appliance payoff models explode
^58 percent increase in requested quotes to thousands of appliance repair businesses y/y (2022-2023)
^43 percent increase in appliance spend in 2023 compared to 2013—rising from $390 to $558 over the decade
Why? 1987. Home appliances...
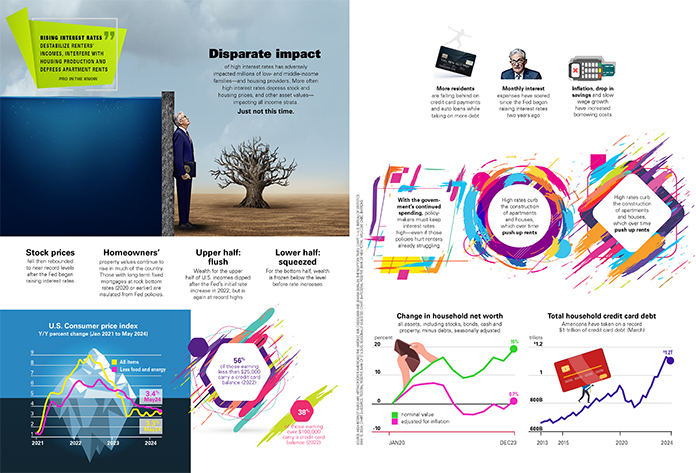
INFOGRAPHIC: Disparate impact of high interest rates
Disparate impact of high interest rates has adversely impacted millions of low- and middle-income families—and housing providers. More often high interest rates depress stock and housing prices, and other asset values— impacting all income...
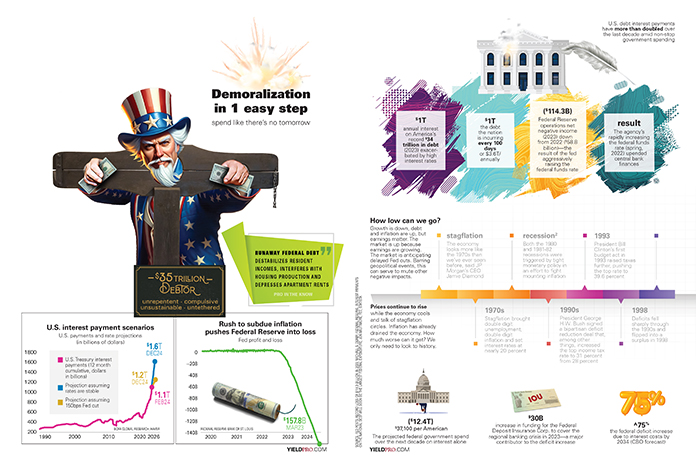
INFOGRAPHIC: Demoralization in 1 easy step
spend like there’s no tomorrow
Runaway federal debt destabilizes resident incomes, interferes with housing production and depresses apartment rents (PRO IN THE KNOW)
$35 trillion debtor
Unrepentant, compulsive, unsustainable, untethered
U.S. interest payment scenarios
U.S. payments and rate projections...
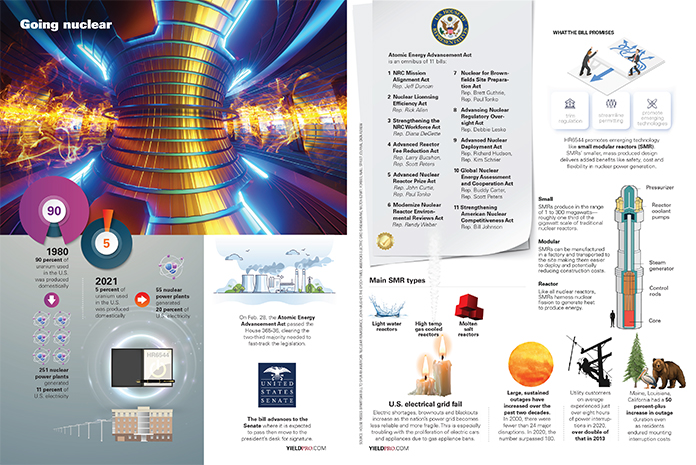
INFOGRAPHIC: Going nuclear
1980
90 percent of uranium used in the U.S. was produced domestically
2021
5 percent of uranium used in the U.S. was produced domestically
55 nuclear power plants generated 20 percent of U.S. electricity
251 nuclear power plants generated...
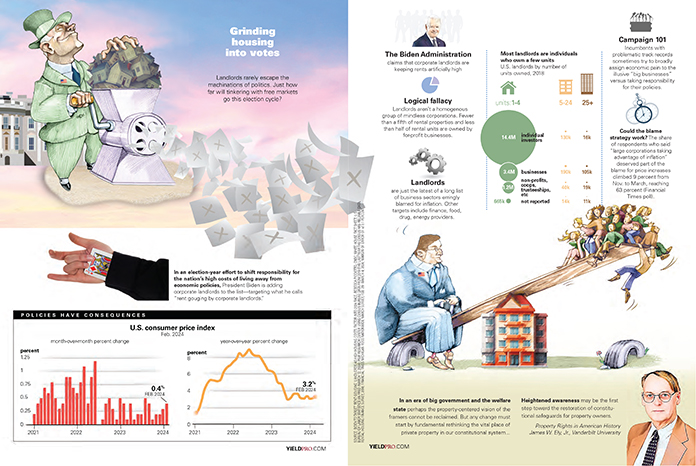
INFOGRAPHIC: Grinding housing into votes
download pdf
Landlords rarely escape the machinations of politics. Just how far will tinkering with free markets go this election cycle?
In an election-year effort to shift responsibility for the nation’s high costs of living away...
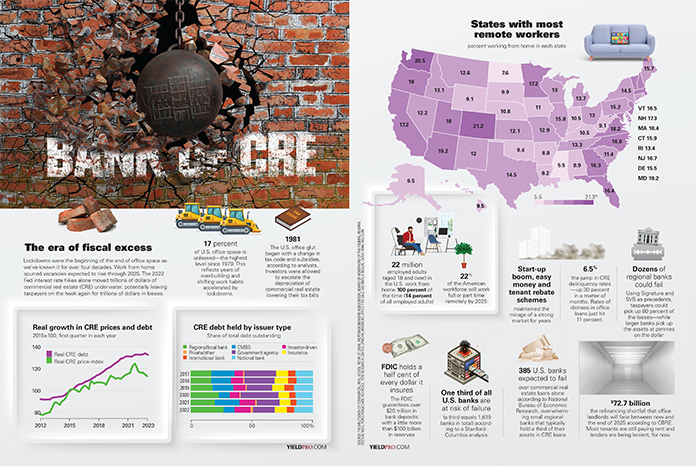
INFOGRAPHIC: The era of fiscal excess
download pdf
Lockdowns were the beginning of the end of office space as we’ve known it for over four decades. Work from home spurred vacancies expected to rise through 2025. The 2022 Fed interest rate...
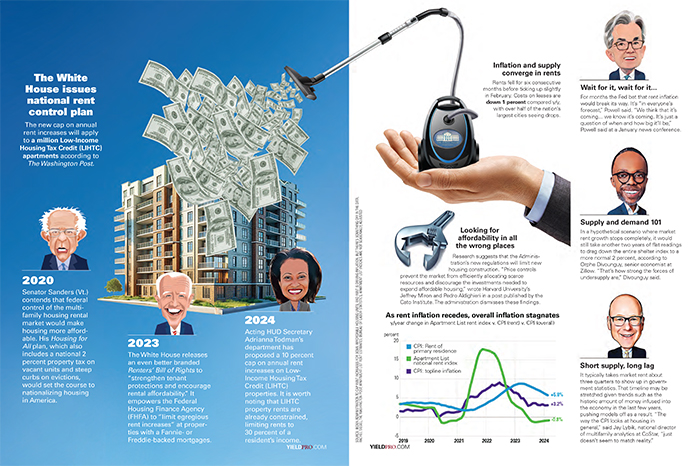
INFOGRAPHIC: The White House issues national rent control plan
download pdf
The new cap on annual rent increases will apply to a million Low-Income Housing Tax Credit (LIHTC) apartments according to The Washington Post.
2020 Senator Sanders (Vt.) contends that federal control of the multifamily...
INFOGRAPHIC: Can governments use building permits to extort property owners?
The Supreme Court will hear a landmark property-rights case (Sheetz v. County of El Dorado) with major economic implications. When a decision will be made is unclear; Chevron was originally ruled on June 25,...
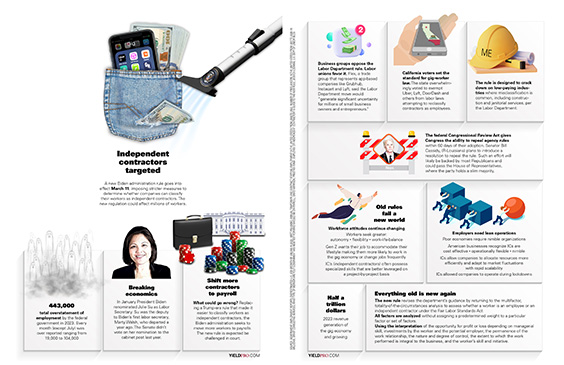
INFOGRAPHIC: Independent contractors targeted
A new Biden administration rule goes into effect March 11, imposing stricter measures to determine whether companies can classify their workers as independent contractors. The new regulation could affect millions of workers.
443,000 total overstatement...
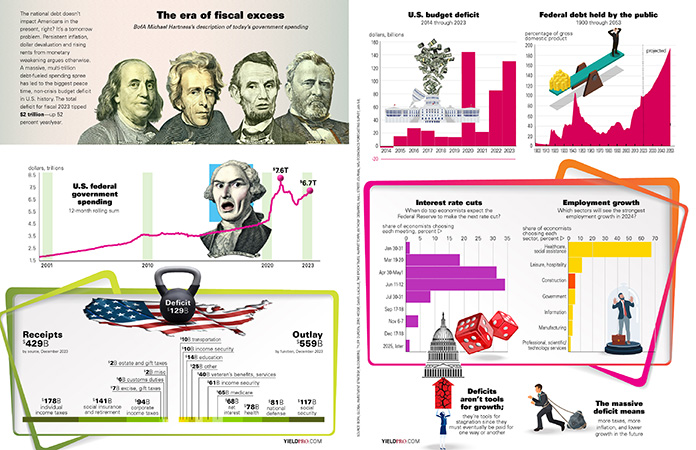
INFOGRAPHIC: The era of fiscal excess
The era of fiscal excess, BofA Michael Hartness’s description of today’s government spending
The national debt doesn’t impact Americans in the present, right? It’s a tomorrow problem. Persistent inflation, dollar devaluation and rising rents from dollar...
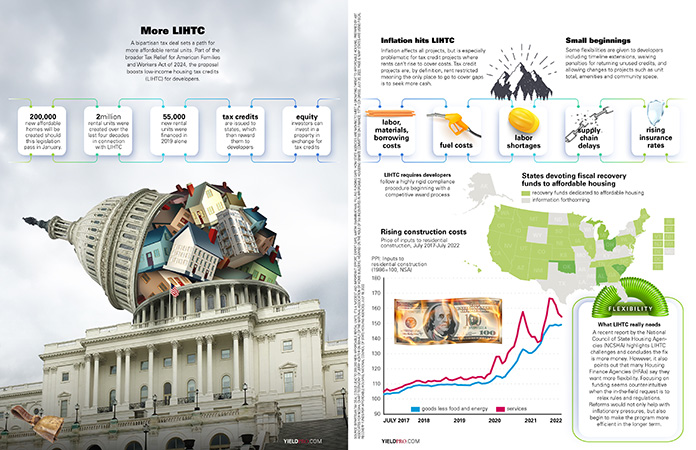
INFOGRAPHIC: More LIHTC
A bipartisan tax deal sets a path for more affordable rental units. Part of the broader Tax Relief for American Families and Workers Act of 2024, the proposal boosts low-income housing tax credits (LIHTC)...
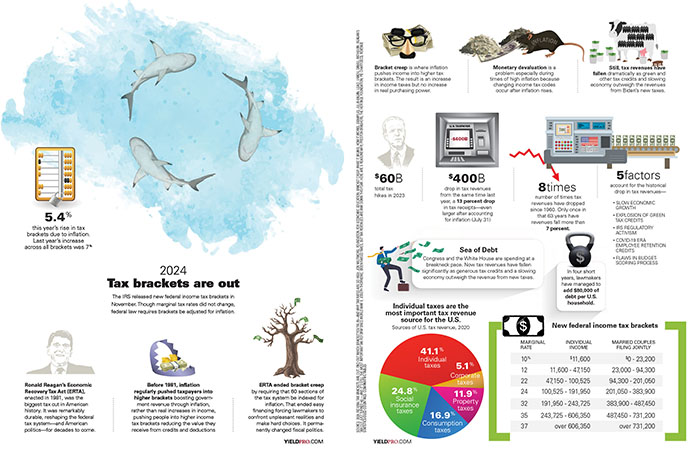
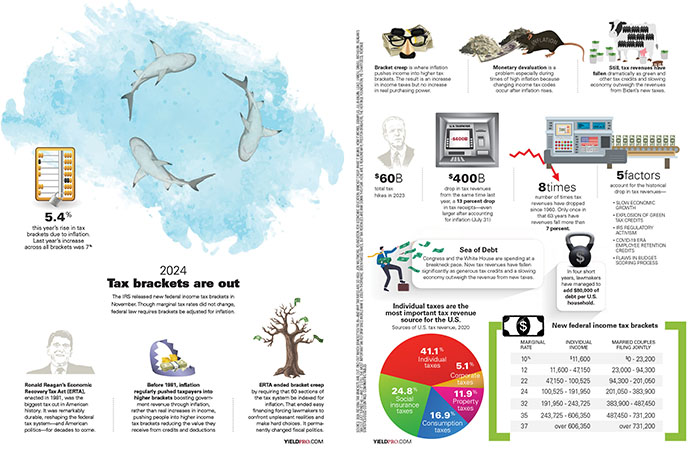
INFOGRAPHIC: 2024 Tax brackets are out
The IRS released new federal income tax brackets in November. Though marginal tax rates did not change, federal law requires brackets be adjusted for inflation.
5.4%
this year’s rise in tax brackets due to inflation. Last...
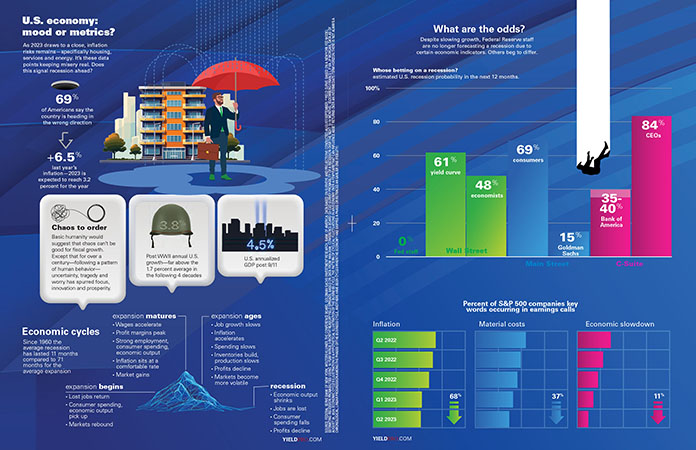
INFOGRAPHIC: U.S. economy: mood or metrics?
As 2023 draws to a close, inflation risks remains—specifically housing, services and energy. It’s these data points keeping misery real. Does this signal recession ahead?
69% of Americans say the country is heading in the...
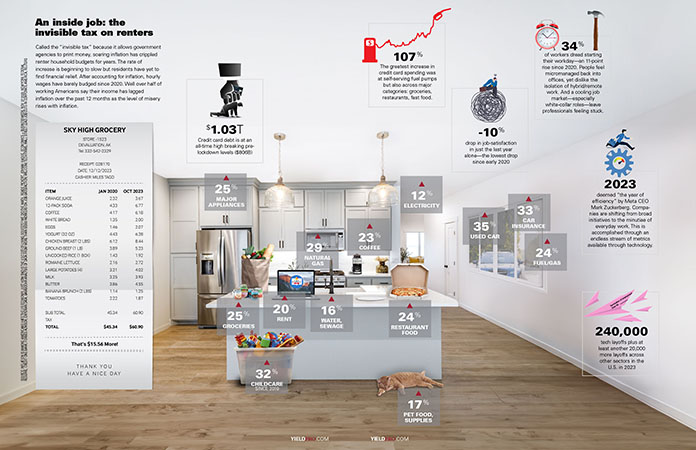
INFOGRAPHIC: An inside job: the invisible tax on renters
Called the “invisible tax” because it allows government agencies to print money, soaring inflation has crippled renter household budgets for years. The rate of increase is beginning to slow but residents have yet to...
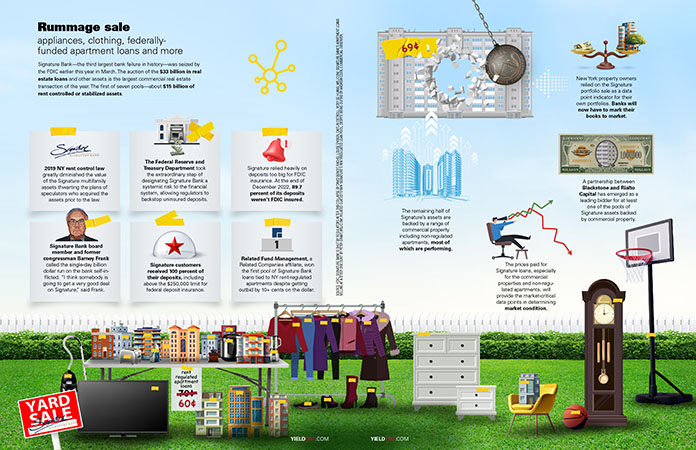
INFOGRAPHIC: Rummage sale: appliances, clothing, federally-funded apartment loans and more
Signature Bank—the third largest bank failure in history—was seized by the FDIC earlier this year in March. The auction of the $33 billion in real estate loans and other assets is the largest commercial...


