Infographic: Urban exodus
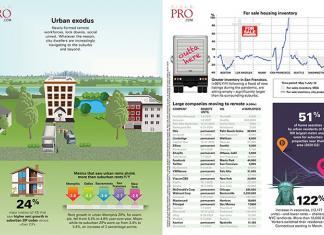
Newly-formed remote workforces, lock downs, social unrest. Whatever the reason, city dwellers are increasingly navigating to the suburbs and beyond.
24% major metros (of 43) that saw higher rent growth in suburban ZIP codes versus...
Infographic: High-speed internet changes the world…again
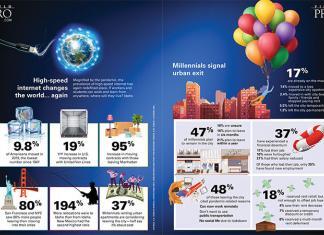
Magnified by the pandemic, the prevalence of high-speed internet has again redefined place. If workers and students can work and learn from anywhere, where will they live? Idaho.
8% of Americans moved in 2019,...
Infographic: Let my workers go
The release of America
As Americans fights to return to work and businesses begin to re-open, a funny thing is happening. Nothing.
0 increase in C19 cases in places restrictions were lifted People are getting back...
Infographic: The Big Chill
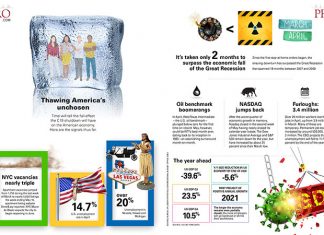
Thawing America’s unchosen
Time will tell the full effect the C19 shutdown will have on the American economy. Here are the signals thus far.
NYC vacancies nearly triple
Apartment vacancies jumped from 1,750 during the last week...
Infographic: Apartment chill
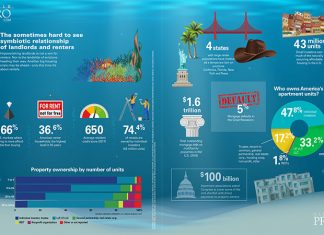
The sometimes hard to see symbiotic relationship of landlords and renters
Impoverishing landlords is not a win for renters. Nor is the landslide of evictions heading their way. Another big housing crisis may be ahead—only...
Infographic: C19 just the facts
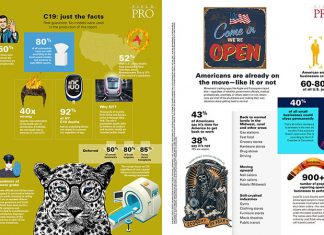
Real guarantee: No models were used in the production of this report.
50% of those who contract the coronavirus are asymptomatic
80% of all coronavirus cases are mild according to the most recent studies...
Infographic: Everyone is essential
UPDATED: April 30, 2020
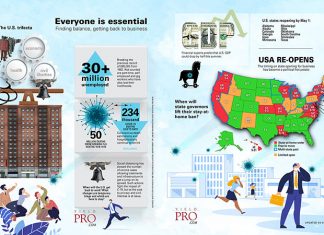
30+ million unemployed
Breaking the previous record of 695,000 from 1982. Not counted are part-time, self—employed and gig workers who have also lost their livelihoods.
50 million deaths from Spanish Flu 1918-1919
234 thousand...
Infographic: COVID-19 A break in the clouds
UPDATED: MAY 7, 2020
COVID-19 genesis
COVID-19 originated in Wuhan, China. Asian Flu, SARS, H7N9 and others were borne of Asia’s close contact with wild animals, poor hygiene and concentrated population.
It‘s thought that COVID-19 was passed...
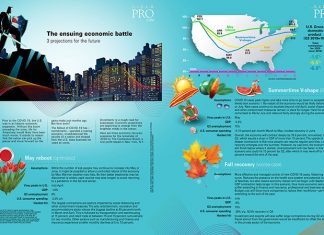
Infographic: The ensuing economic battle
3 projections for the future
Prior to the COVID-19, the U.S. was in an historic economic expansion. Without this boom preceding the crisis, life for Americans would likely have been much worse. It stands to...
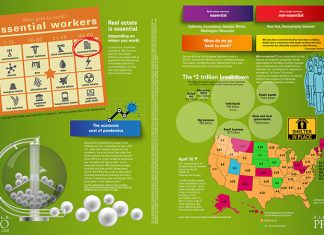
Infographic: Essential workers
Download PDF
Updated: April 16, 2020
Who gets to work?
essential workers
Real estate is essential (depending on where you work)
Construction. Apartment operations. Maintenance services. Real estate functions are categorized as essential in the Department of Homeland Security’s...
Where have all the apartments gone?
Long time ago. When will they ever learn?
The way government regulates and taxes business and transactions directly shapes investment.
Good regulation addresses market failures that hinder productive investment. It reconciles the interests of firms with...
ISAs set to transform the labor market
Income share agreement (ISAs) fund education. Upon completion, learners pay a percentage of their salary for a term.
Lenders correlate interest rate and pay-back period with borrower’s potential career outcome.
This may mean varying tuitions for...
The vanishing apartment
The affordability crisis is creeping up into middle-income households according to Harvard Joint Center for Housing Studies’ 2020 report, America’s Rental Housing.
48% of renter households are considered cost-burdened. What does this mean? 21 million...
Infographic: Unplugged in California
2 million residents were without power for days at a time in the state’s outages
6,402 wildfires in Calif. as of Nov. 3. Wind-induced fire season runs Oct. to April. Summer fire season runs June...
Infographic: Quantum supremacy
The man in the machine
Programmed by humans, algorithms begin with a logic tree specifying every facet of the code’s behavior from content prioritization to blacklisting. With Google’s near monopoly, what hangs in the...


