Tag: PRO Visualization
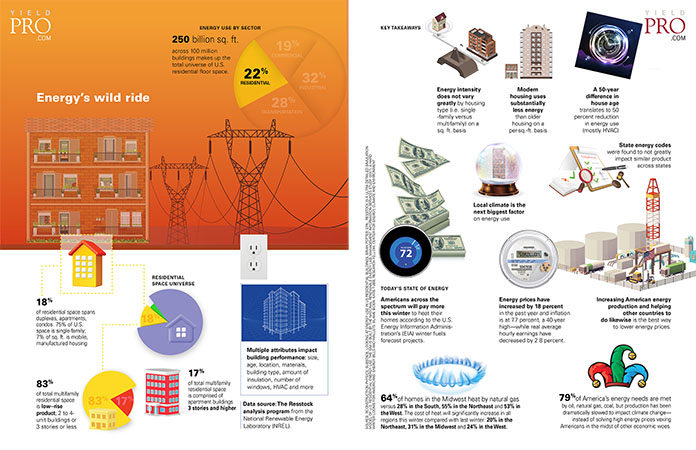
Infographic: Energy’s wild ride
250 billion sq. ft. across 100 million buildings makes up the total universe of U.S. residential floor space.
RESIDENTIAL SPACE UNIVERSE
18 percent of residential...
Infographic: Can’t beat ‘em
San Francisco-based Airbnb’s new internet listing service (ILS) is exclusively for rental apartments. Dubbed Airbnb-Friendly Apartments, the platform already includes notables Equity Residential, Greystar,...
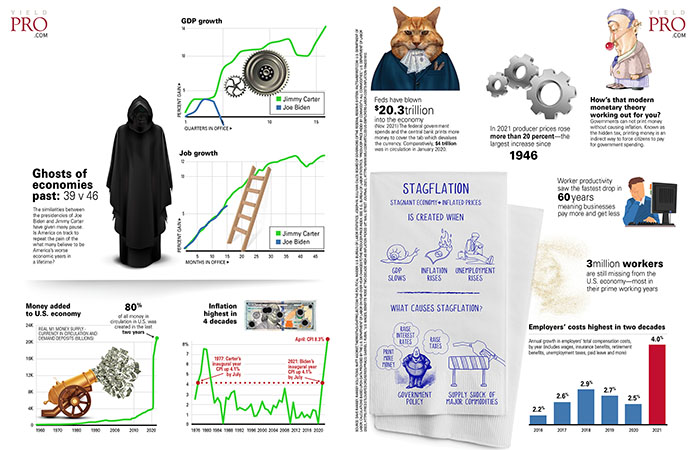
Infographic: Stagflation
Ghosts of economies past: 39 v 46
The similarities between the presidencies of Joe Biden and Jimmy Carter have given many pause. Is America on...
Infographic: Darkest before the light
Darkest before the light: Preparing for a failing U.S. electric grid
As the number and duration of U.S. power outages rises, carbon-based power plants are being...
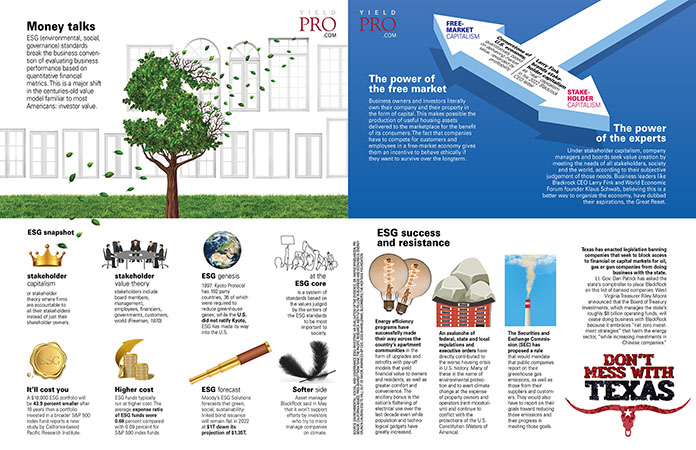
Infographic: Money talks
ESG (environmental, social, governance) standards break the business convention of evaluating business performance based on quantitative financial metrics. This is a major shift in...
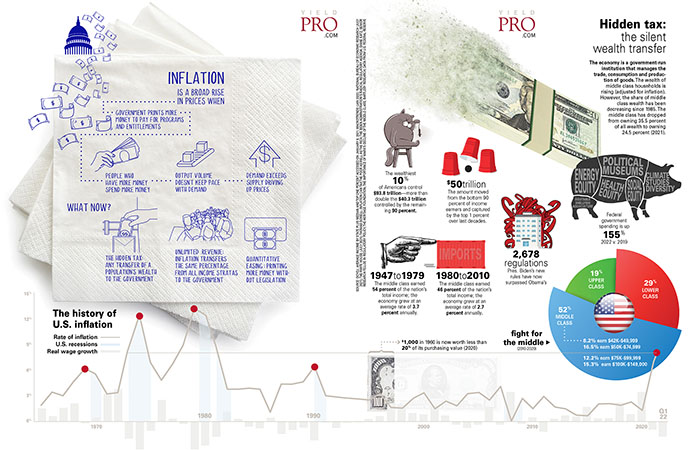
Infographic: Inflation
Inflation is a broad rise in prices when
Government prints more money to pay for programs and entitlements
People who have more money...
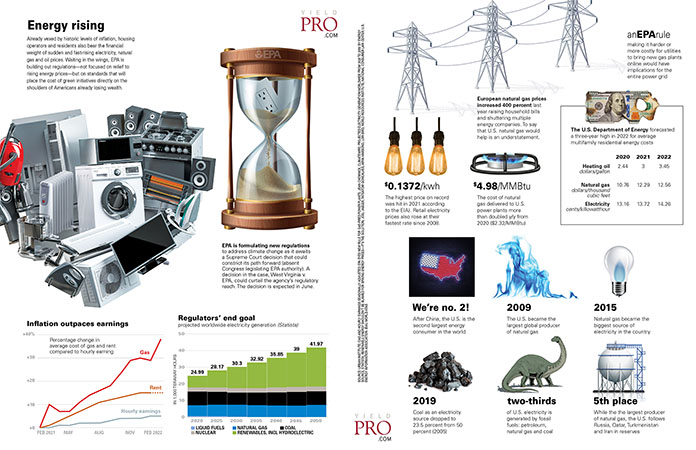
Infographic: Energy rising
Energy rising
Already vexed by historic levels of inflation, housing operators and residents also bare the financial weight of sudden and fast-rising electricity, natural gas...
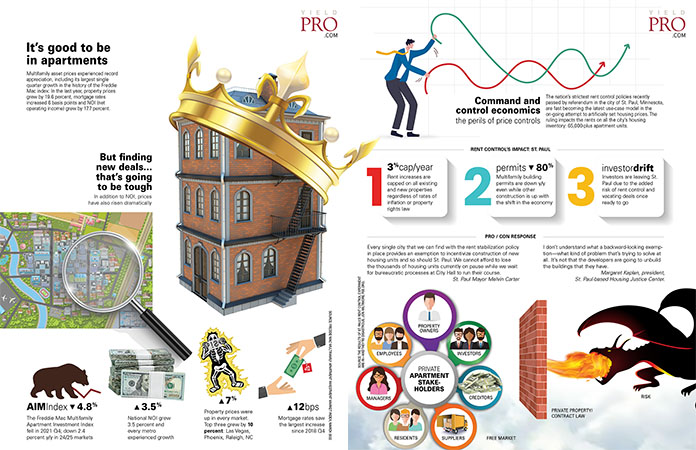
Infographic: It’s good to be in apartments
Multifamily assets experienced record appreciation, including its largest single quarter growth in the history of the Freddie Mac index: In the last year, property...
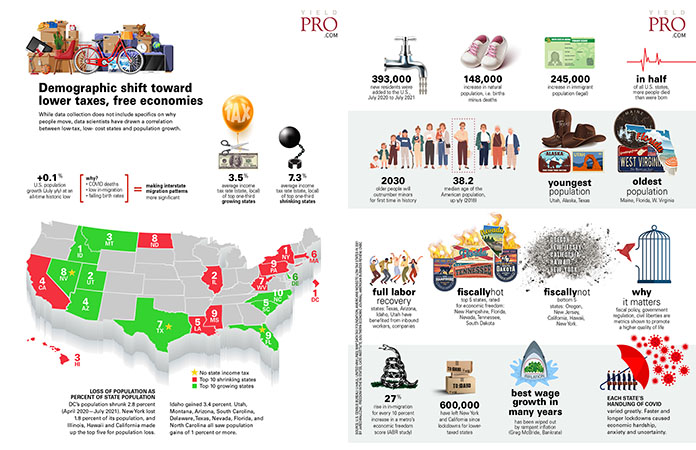
Infographic: Demographic shift toward lower taxes, free economies
While data collection does not include specifics on why people move, data scientists have drawn a correlation between low-tax, low-cost states and population growth.
+0.1%...
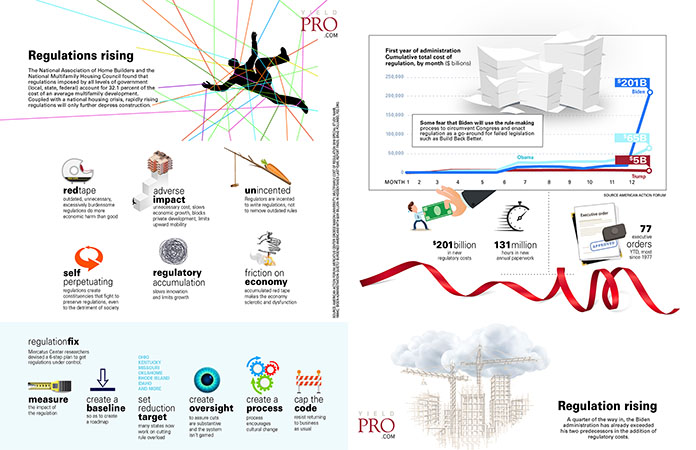
Infographic: Regulations rising
The National Association of Home Builders and the National Multifamily Housing Council found that regulations imposed by all levels of government (local, state, federal)...
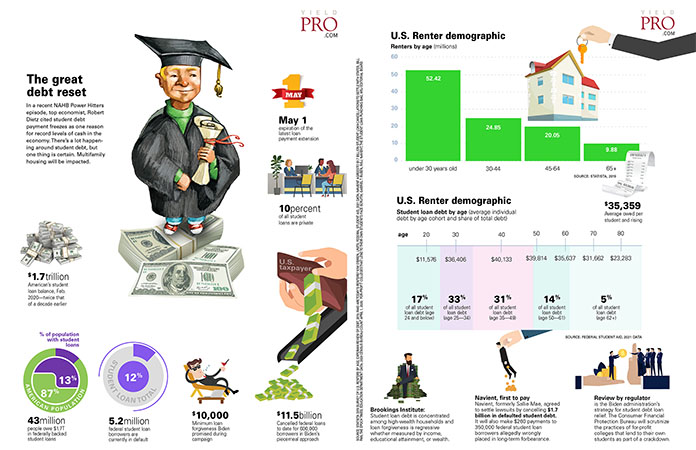
Infographic: The great debt reset
In a recent NAHB Power Hitters episode, top economist, Robert Dietz cited student debt payment freezes as one reason for record levels of cash...
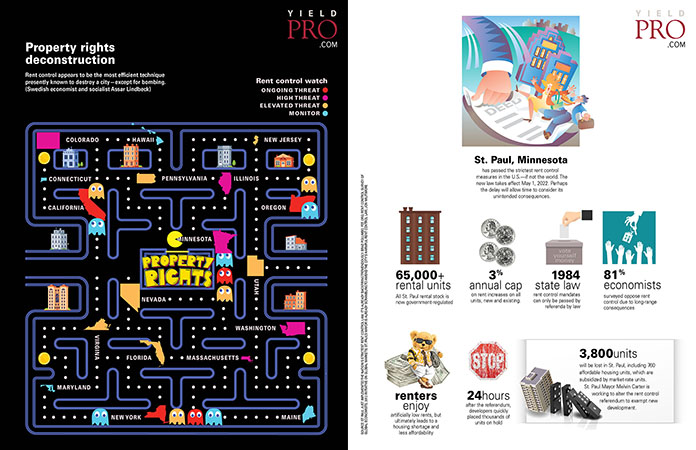
Infographic: Property rights deconstruction
Rent control appears to be the most efficient technique presently known to destroy a city—except for bombing. (Swedish economist and socialist Assar Lindbeck)
St. Paul,...
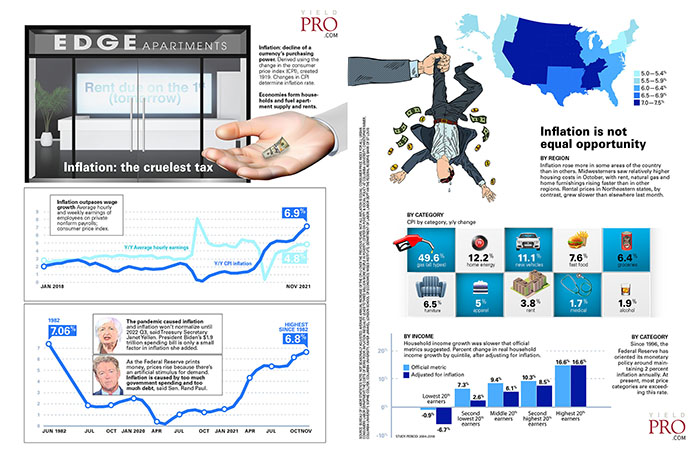
Infographic: Inflation, the cruelest tax
Inflation: decline of a currency’s purchasing power. Derived using the change in the consumer price index (CPI), created 1919. Changes in CPI determine inflation...
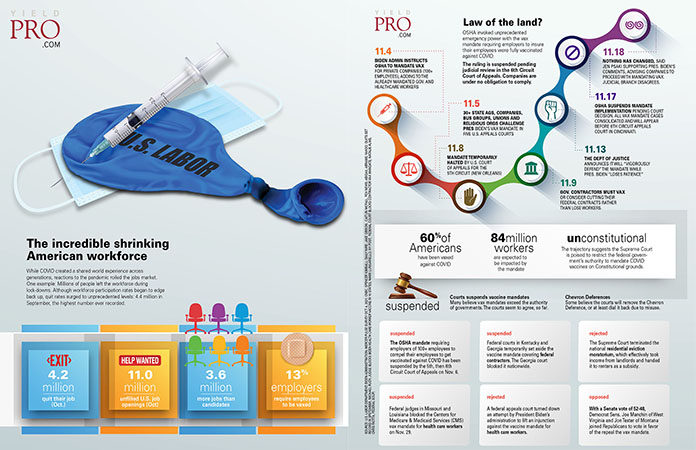
Infographic: The incredible shrinking American workforce
While COVID created a shared world experience across generations, reactions to the pandemic roiled the jobs market. One example: Millions of people left the...
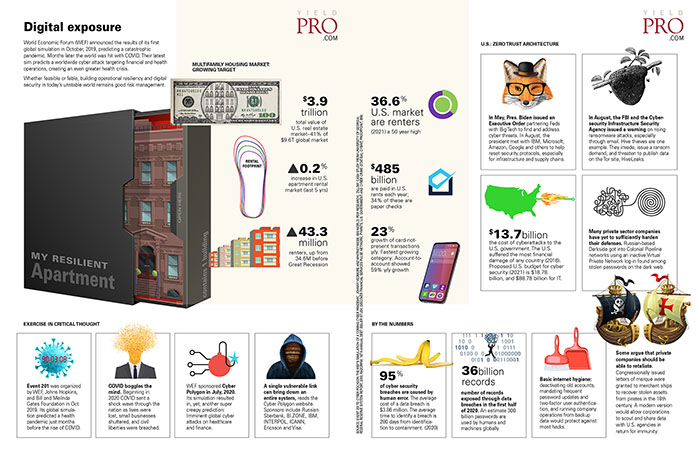
Infographic: Digital exposure
World Economic Forum (WEF) announced the results of its first global simulation in October, 2019, predicting a catastrophic pandemic. Months later the world was...


