Infographic: Man-made chaos
State-mandated lockdowns began a cascade that especially devastated lower income people and continues to adversely impact the business of property management.
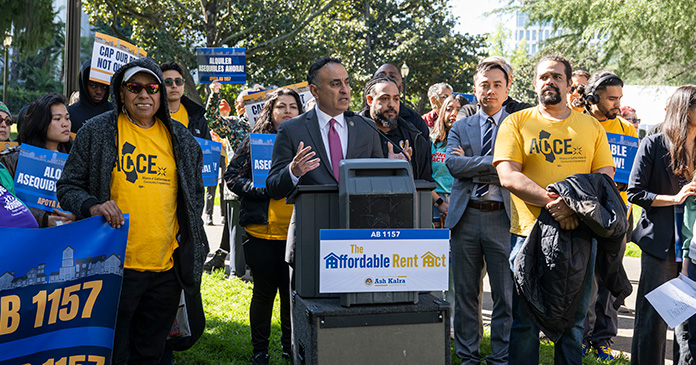
Government interference
with the ability to collect rent has left many investors unable to maintain...
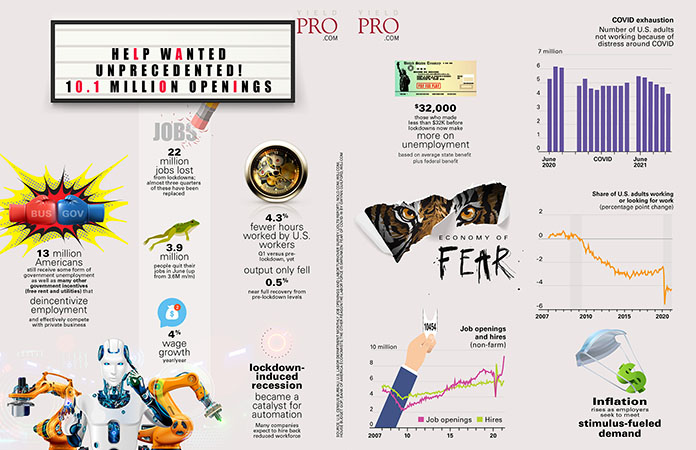
Infographic: Help wanted
Unprecedented! 10.1 million openings
Jobs
22 million jobs lost from lockdowns; almost three quarters of these have been replaced
13 million Americans still receive some form of government unemployment as well as many other government incentives (free...
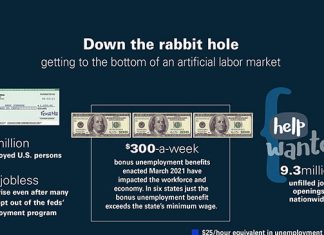
Infographic: Down the rabbit hole
Getting to the bottom of an artificial labor market
3 million unemployed U.S. persons
New jobless claims rise even after many states opt out of the feds’ unemployment program
$300-a-week bonus unemployment benefits enacted...
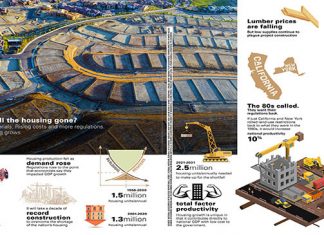
Infographic: Where has all the housing gone?
No labor. No materials. Rising costs and more regulations. The lack of housing grows.
5 million more housing units needed to pace demand
5 million of these are multifamily units
Housing production fell as demand...
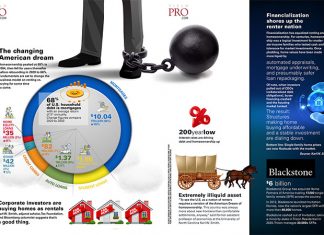
Infographic: The changing American dream
Homeownership peaked at 69% in 2004, then fell for years thereafter before rebounding in 2020 to 66%. Fundamentals are set to change the business model on renting vs. buying for some time to come.
Corporate...
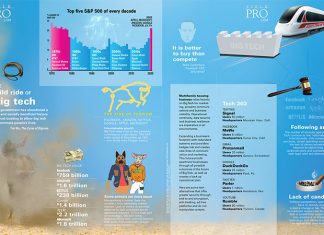
Infographic: The wild ride of Big Tech
Our government has abandoned a rich and socially beneficial history of trust-busting to allow big tech to dominate people’s lives.
Tim Wu, The Curse of Bigness
Big tech value
Facebook, $759 billion
Amazon, $1.6 trillion
Netflix,...
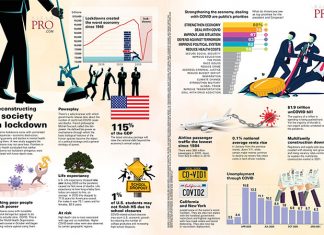
Infographic: Deconstructing a society in lockdown
Economic lockdowns come with unintended consequences—economic destruction, surging poverty and decline in mental health among them. A new study suggests the lockdowns may not save lives. Frontiers in Public Health concluded that neither lockdowns...
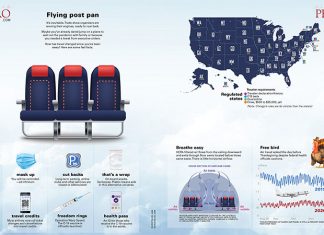
Infographic: Flying post pan
It’s inevitable. Trade show organizers are revving their engines, ready to roar back.
Maybe you’ve already dared jump on a plane to wait out the pandemic with family or because you needed a break from...
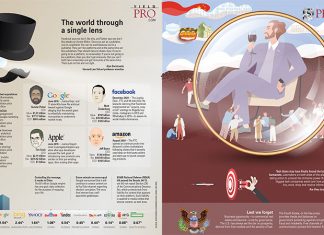
Infographic: The world through a single lens
Facebook says we don’t like this, and Twitter says we don’t like attacks on Hunter Biden. Once you act as a publisher, you’re a publisher. You can be sued because you’re a publisher. They...
Infographic: C19 winners and losers
ZOOM
video conferencing, San Jose, Calif.
$664 million revenue growth May to June, driving Y/Y profits from $5.5 million to $186 million
AMAZON
e-commerce, Seattle, Wash.
$90 billion total revenue Q2, Amazon handled half of...
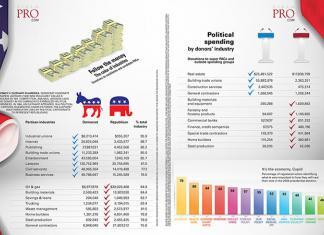
Infographic: Follow the money
The color of industries
Donations to candidates and candidate PACs
Political spending by donors’ industry
Donations to super PACs and outside spending groups
Partisan industries
Democrat
Republican
% total industry
Industrial unions
$8,213,414
$355,207
95.9
Internet
26,825,046
3,433,577
88.7
Publishing
27,887,021
4,452,566
86.2
Building trade unions
11,233,289
1,982,241
85
Entertainment
43,580,054
7,243,169
85.7
Lawyers
130,752,964
30,756,695
81
Civil servants
48,966,264
14,419,488
77.3
Business services
49,788,947
15,245,589
76.6
Oil & gas
$6,977,878
$39,026,468
84.8
Building materials
2,569,423
13,907,030
84.4
Savings & loans
204,540
1,049,993
83.7
Trucking
1,234,077
6,194,015
83.4
Waste management
585,803
2,573,977
81.5
Home...
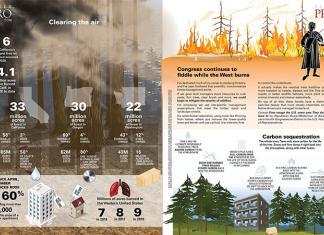
Infographic: Clearing the air
CALIFORNIA
6 of California’s largest fires on record occurred in 2020.
1 million acres have burned in California in 2020 to date
33 million acres of forest in California
58% federally owned
3% state...
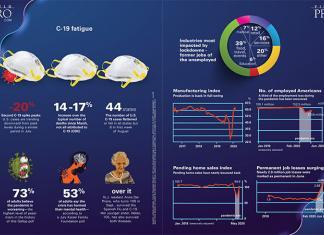
Infographic: C-19 fatigue
-20% Second C-19 spike peaks. S. cases are trending downward from peak levels during a similar period in July
14-17% increase over the typical number of deaths since March, not all attributed to...
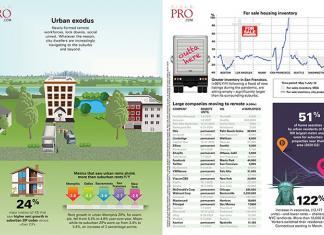
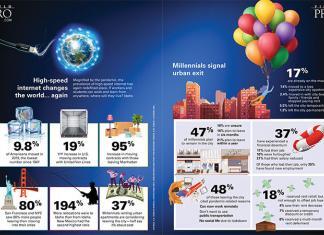
Infographic: Urban exodus
Newly-formed remote workforces, lock downs, social unrest. Whatever the reason, city dwellers are increasingly navigating to the suburbs and beyond.
24% major metros (of 43) that saw higher rent growth in suburban ZIP codes versus...
Infographic: High-speed internet changes the world…again
Magnified by the pandemic, the prevalence of high-speed internet has again redefined place. If workers and students can work and learn from anywhere, where will they live? Idaho.
8% of Americans moved in 2019,...


