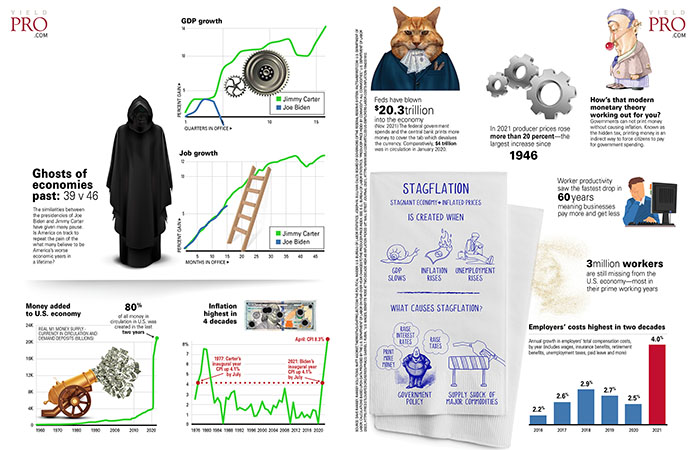
Infographic: Stagflation
Ghosts of economies past: 39 v 46
The similarities between the presidencies of Joe Biden and Jimmy Carter have given many pause. Is America on track to repeat the pain of the what many believe...
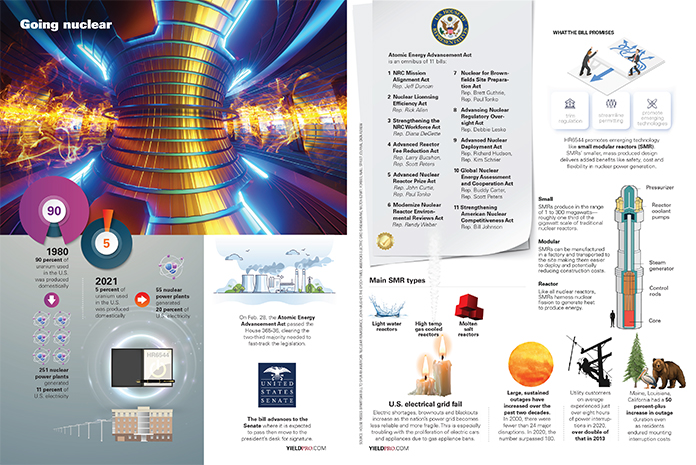
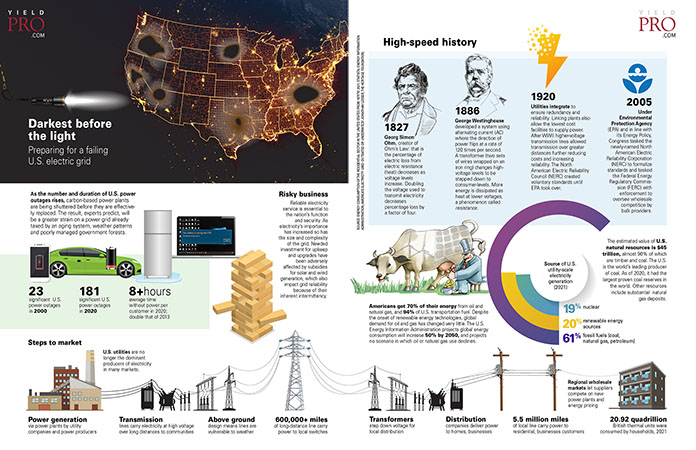
Infographic: Darkest before the light
Darkest before the light: Preparing for a failing U.S. electric grid
As the number and duration of U.S. power outages rises, carbon-based power plants are being shuttered before they are effectively replaced. The result, experts predict,...
Infographic: Money talks
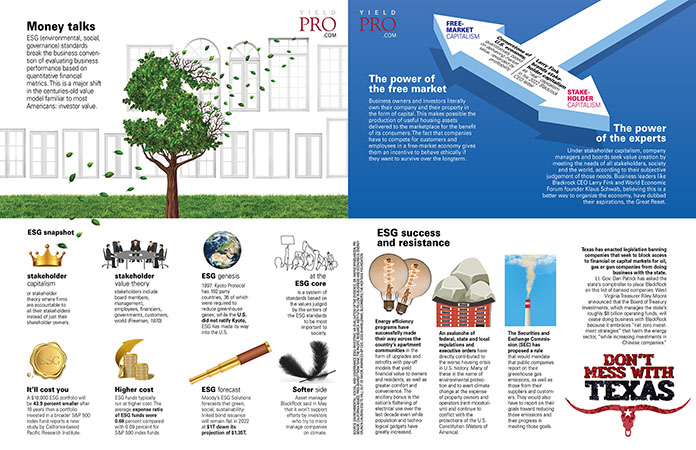
ESG (environmental, social, governance) standards break the business convention of evaluating business performance based on quantitative financial metrics. This is a major shift in the centuries-old value model familiar to most Americans: investor value.
ESG...
Infographic: Inflation
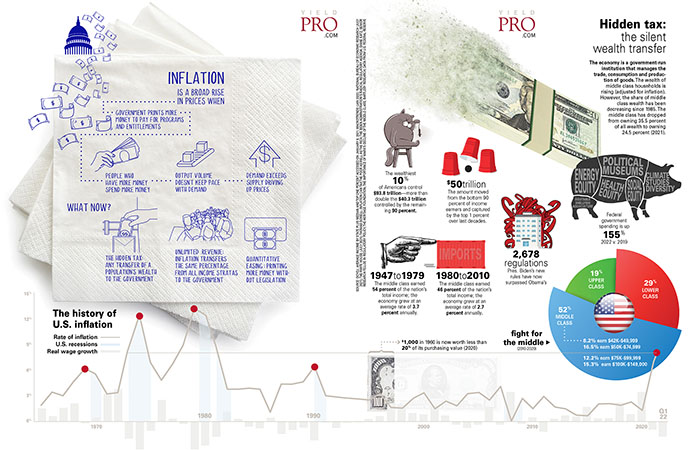
Inflation is a broad rise in prices when
Government prints more money to pay for programs and entitlements
People who have more money spend more money
Output volume doesn’t keep pace with demand
...
Infographic: Energy rising
Energy rising
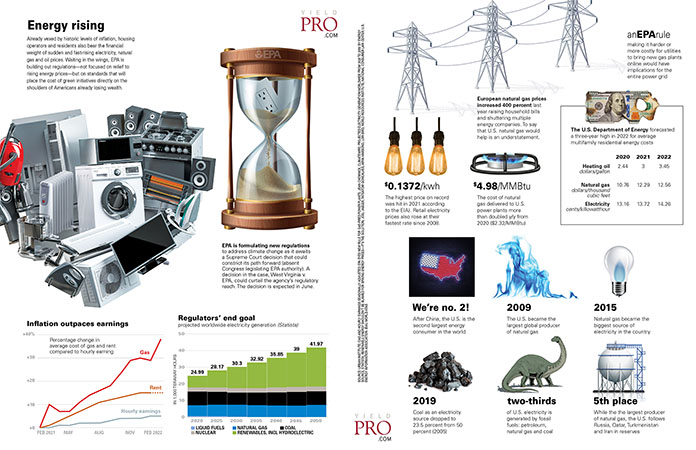
Already vexed by historic levels of inflation, housing operators and residents also bare the financial weight of sudden and fast-rising electricity, natural gas and oil prices. Waiting in the wings, EPA is building...
Infographic: It’s good to be in apartments
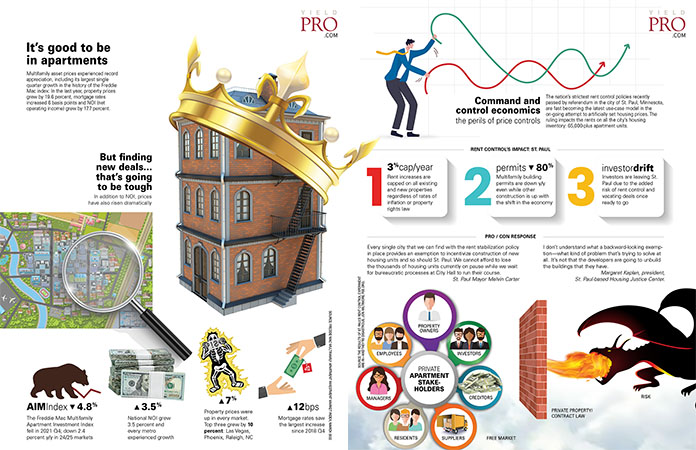
Multifamily assets experienced record appreciation, including its largest single quarter growth in the history of the Freddie Mac index: In the last year, property prices grew by 19.6 percent, mortgage rates increased 6 basis...
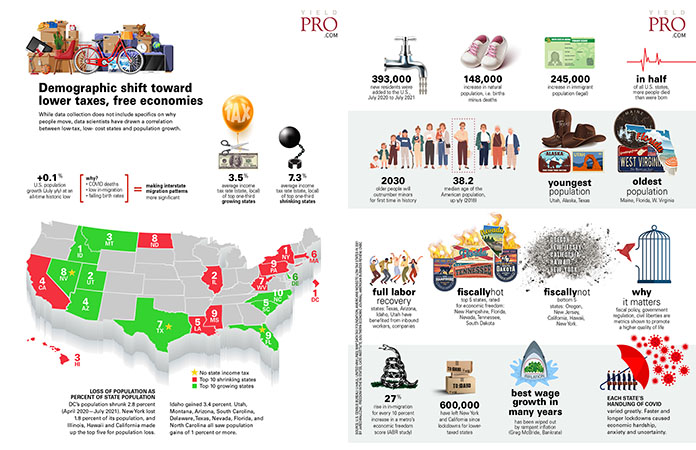
Infographic: Demographic shift toward lower taxes, free economies
While data collection does not include specifics on why people move, data scientists have drawn a correlation between low-tax, low-cost states and population growth.
+0.1% U.S. population growth (July y/y) at an all-time historic low
Why?
...
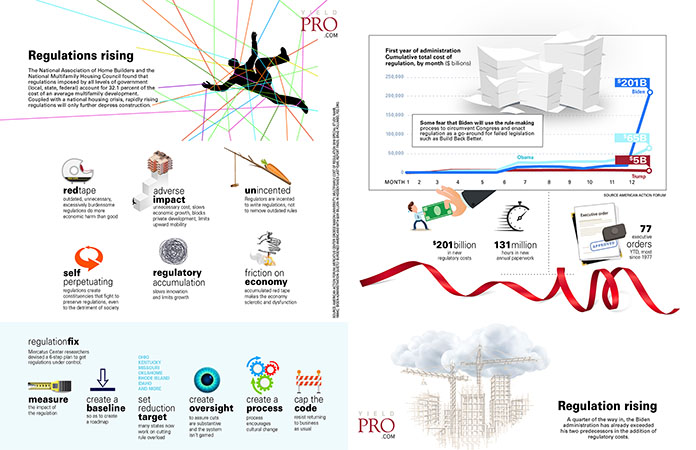
Infographic: Regulations rising
The National Association of Home Builders and the National Multifamily Housing Council found that regulations imposed by all levels of government (local, state, federal) account for 32.1 percent of the cost of an average...
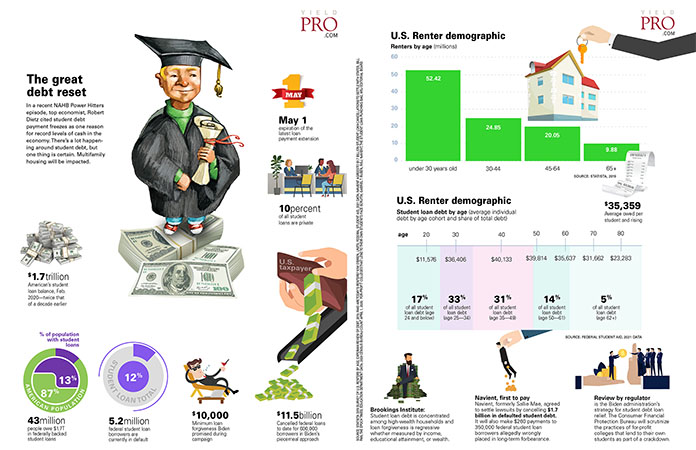
Infographic: The great debt reset
In a recent NAHB Power Hitters episode, top economist, Robert Dietz cited student debt payment freezes as one reason for record levels of cash in the economy. There’s a lot happening around student debt,...
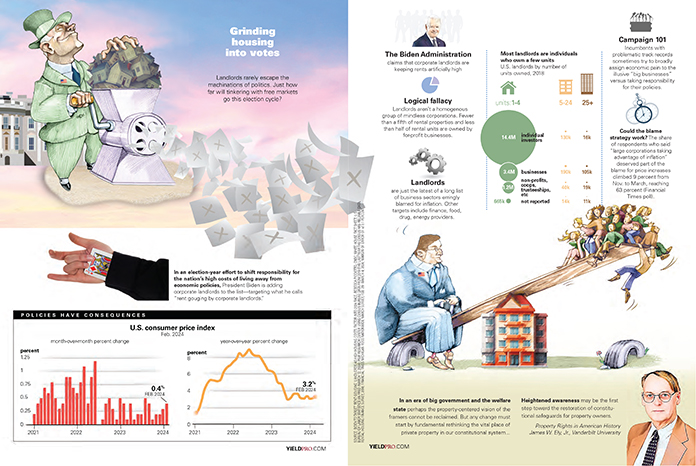
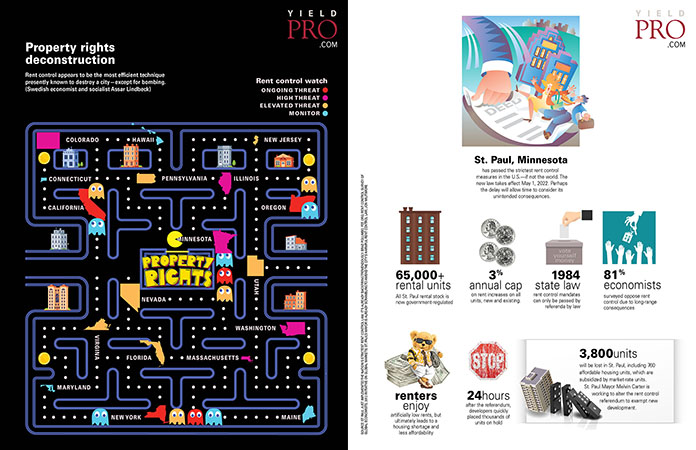
Infographic: Property rights deconstruction
Rent control appears to be the most efficient technique presently known to destroy a city—except for bombing. (Swedish economist and socialist Assar Lindbeck)
St. Paul, Minnesota
has passed the strictest rent control measures in the U.S.—if...
Infographic: Inflation, the cruelest tax
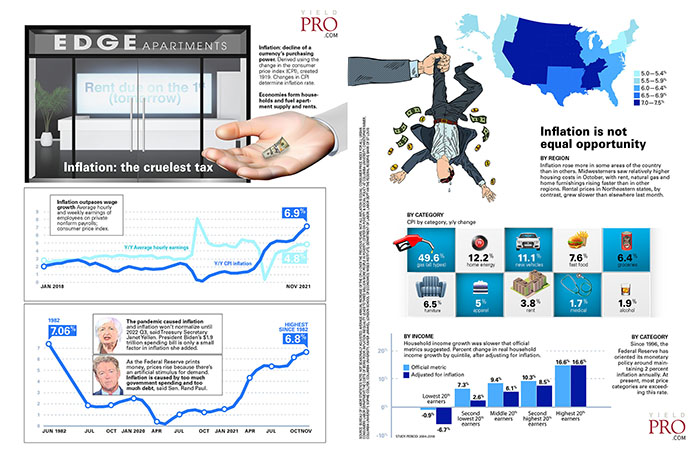
Inflation: decline of a currency’s purchasing power. Derived using the change in the consumer price index (CPI), created 1919. Changes in CPI determine inflation rate.
Economies form households and fuel apartment supply and rents.
Inflation...
Infographic: The incredible shrinking American workforce
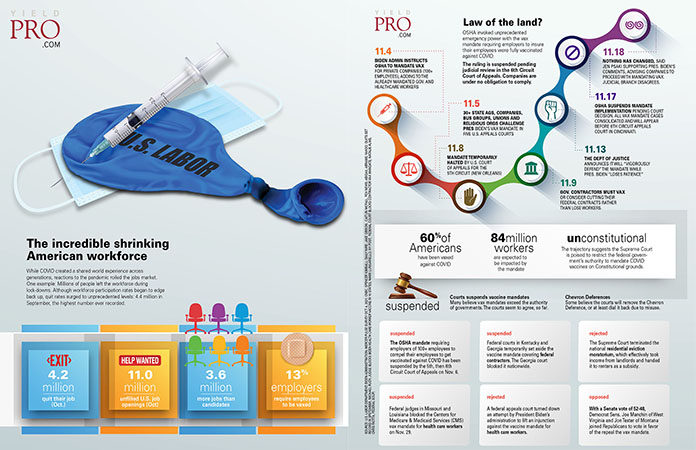
While COVID created a shared world experience across generations, reactions to the pandemic roiled the jobs market. One example: Millions of people left the workforce during lock-downs. Although workforce participation rates began to edge...
Infographic: Digital exposure
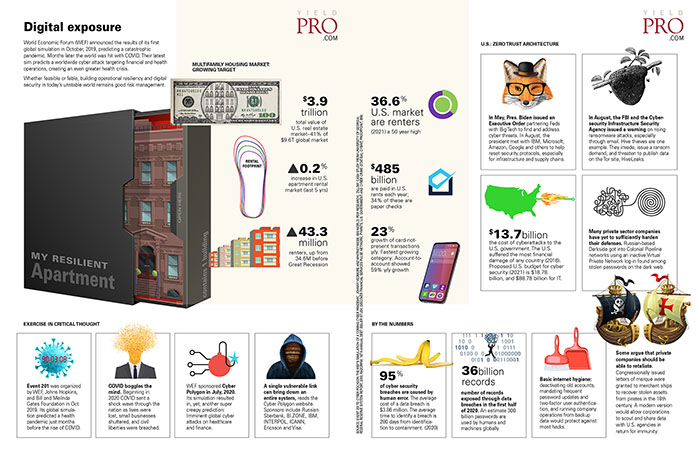
World Economic Forum (WEF) announced the results of its first global simulation in October, 2019, predicting a catastrophic pandemic. Months later the world was hit with COVID. Their latest sim predicts a worldwide cyber...
Infographic: Pandemic pivot
Lockdowns fueled yet another wave of automation for many property management businesses. AI and 5G are expected to continue the momentum as the internet of things continues to grow and expand.
3 million jobs...
Infographic: Infrastructure bill
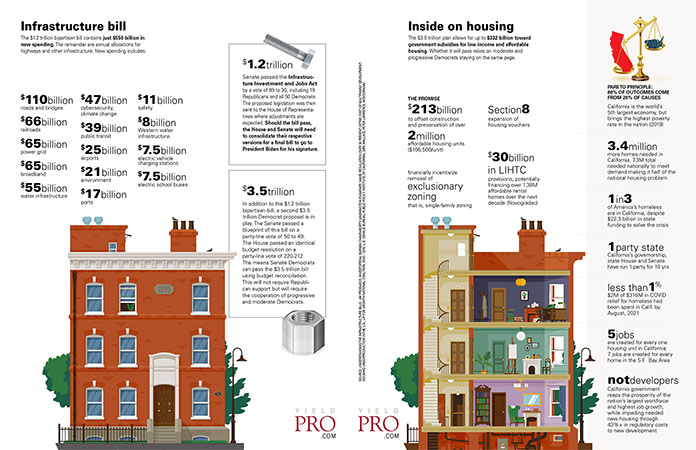
The $1.2 trillion bipartisan bill contains just $550 billion in new spending. The remainder are annual allocations for highways and other infrastructure. New spending includes:
$110 billion roads and bridges
$66 billion railroads
$65...


