Tag: Infographic
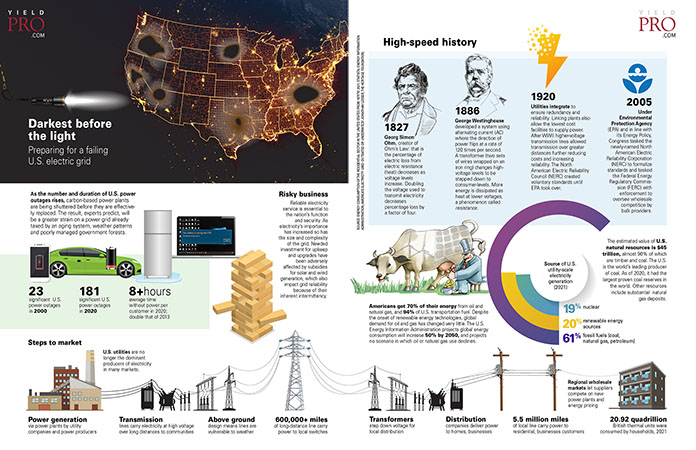
Infographic: Darkest before the light
Darkest before the light: Preparing for a failing U.S. electric grid
As the number and duration of U.S. power outages rises, carbon-based power plants are being...
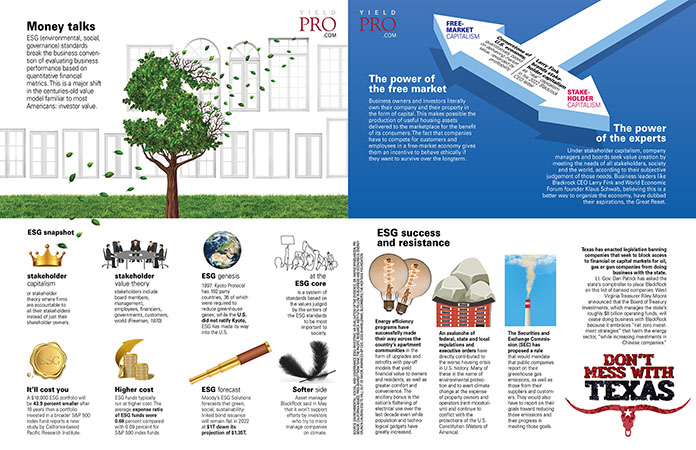
Infographic: Money talks
ESG (environmental, social, governance) standards break the business convention of evaluating business performance based on quantitative financial metrics. This is a major shift in...
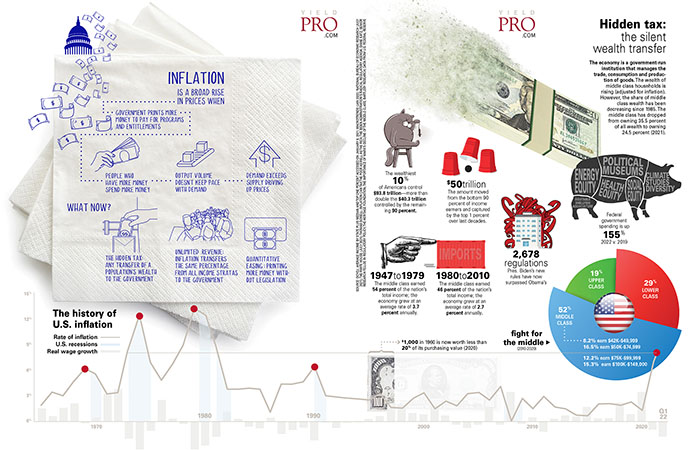
Infographic: Inflation
Inflation is a broad rise in prices when
Government prints more money to pay for programs and entitlements
People who have more money...
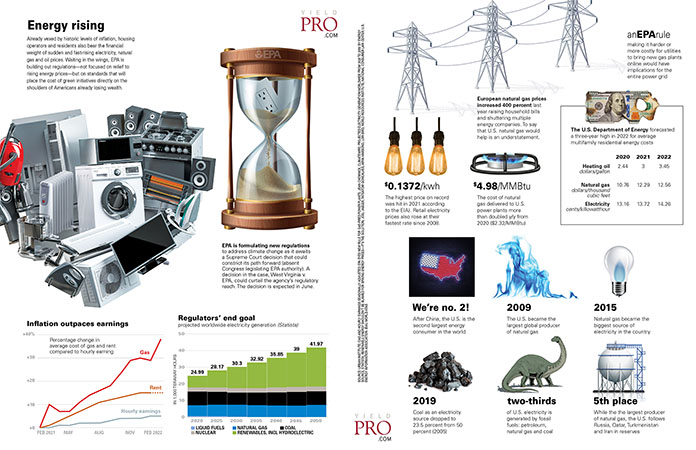
Infographic: Energy rising
Energy rising
Already vexed by historic levels of inflation, housing operators and residents also bare the financial weight of sudden and fast-rising electricity, natural gas...
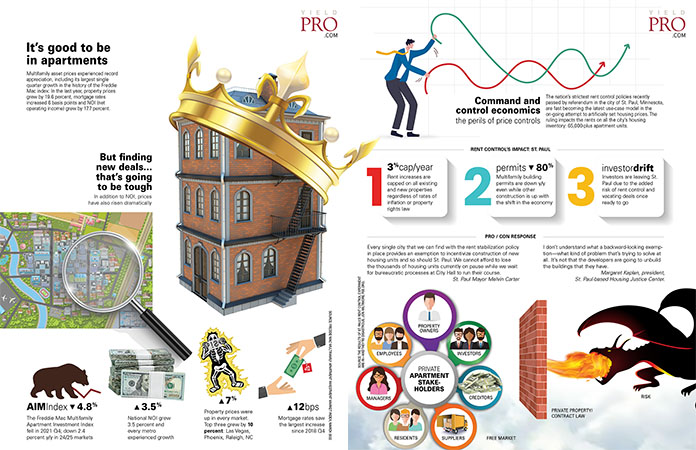
Infographic: It’s good to be in apartments
Multifamily assets experienced record appreciation, including its largest single quarter growth in the history of the Freddie Mac index: In the last year, property...
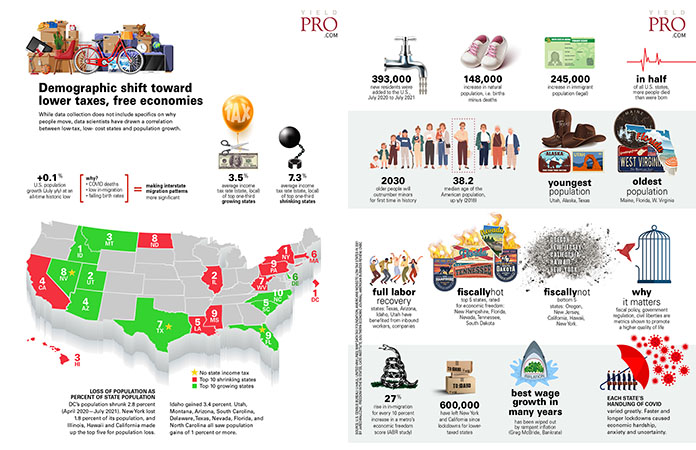
Infographic: Demographic shift toward lower taxes, free economies
While data collection does not include specifics on why people move, data scientists have drawn a correlation between low-tax, low-cost states and population growth.
+0.1%...
Infographic: The wild ride of Big Tech
Our government has abandoned a rich and socially beneficial history of trust-busting to allow big tech to dominate people’s lives.
Tim Wu, The Curse of...
Infographic: Deconstructing a society in lockdown
Economic lockdowns come with unintended consequences—economic destruction, surging poverty and decline in mental health among them. A new study suggests the lockdowns may not...
Infographic: Flying post pan
It’s inevitable. Trade show organizers are revving their engines, ready to roar back.
Maybe you’ve already dared jump on a plane to wait out the...
Infographic: The world through a single lens
Facebook says we don’t like this, and Twitter says we don’t like attacks on Hunter Biden. Once you act as a publisher, you’re a...
Infographic: C19 winners and losers
ZOOM
video conferencing, San Jose, Calif.
$664 million revenue growth May to June, driving Y/Y profits from $5.5 million to $186 million
AMAZON
e-commerce, Seattle,...
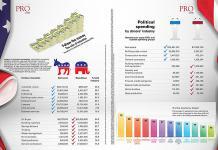
Infographic: Follow the money
The color of industries
Donations to candidates and candidate PACs
Political spending by donors’ industry
Donations to super PACs and outside spending groups
Partisan industries
Democrat
Republican
% total industry
Industrial unions
$8,213,414
$355,207
95.9
Internet
26,825,046
3,433,577
88.7
Publishing
27,887,021
4,452,566
86.2
Building...
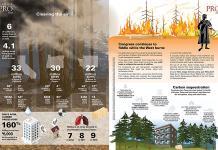
Infographic: Clearing the air
CALIFORNIA
6 of California’s largest fires on record occurred in 2020.
1 million acres have burned in California in 2020 to date
33 million...
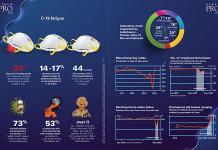
Infographic: C-19 fatigue
-20% Second C-19 spike peaks. S. cases are trending downward from peak levels during a similar period in July
14-17% increase over the...
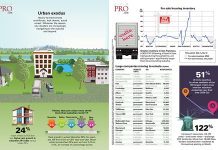
Infographic: Urban exodus
Newly-formed remote workforces, lock downs, social unrest. Whatever the reason, city dwellers are increasingly navigating to the suburbs and beyond.
24% major metros (of 43)...


